Introduction
The electricity demand is growing faster, especially in countries with rapid industrialization, such as China and India [1]. At the same time, the emergent digitalization of economies is imposing greater demands on the reliability of the electricity supply. For example, financial losses can be caused even by momentary interruptions.
Although the growth rate of renewable energy generation is high, and its expectations promise a gradual increase, the contribution of renewable energies to the global energy mix is still minimal [1]. Moreover, renewable energies, especially those from intermittent and variable sources (e.g., wind and solar), pose additional challenges. No less important is the availability, which highlights the need for energy storage and systems to coordinate the available sources of power generation with consumption sinks. To integrate the increasing amount of renewable energy generation and, at the same time, significantly improve efficiency along the value chain, massive changes are required throughout the electrical system and how it must be structured and operated. The term Smart Grid (SG) has been coined for this future evolutionary system, which provides a solution to the problems posed. SGs aim to optimize the electricity distribution network to the maximum so that this resource is used efficiently and sustainably. For this, the latest technologies are used.
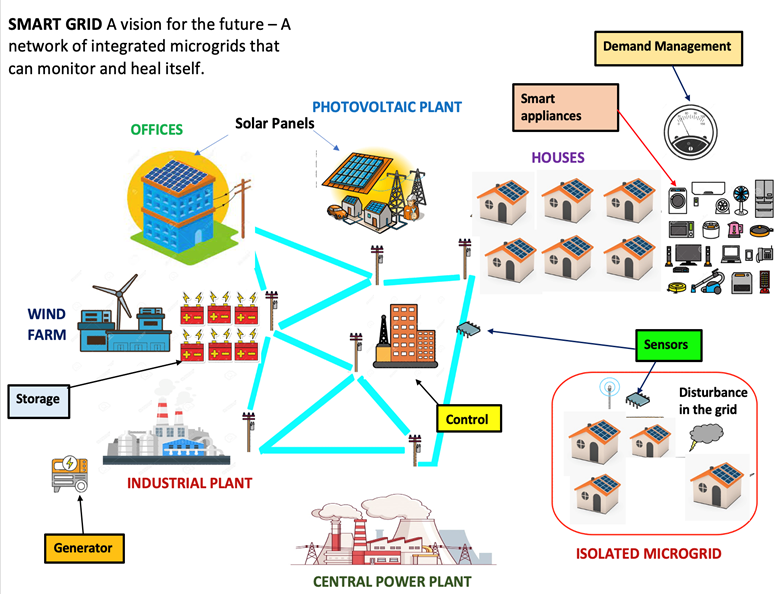
An SG allows bidirectional communication between the final consumer and the electricity companies (see Figure 1). The information gained allows electricity companies to perform more effective operations [2]. The importance of SGs in the electricity sector and modern society, in general, is because currently, we are looking to reduce the use of fossil fuels as energy sources and reduce CO2 in the atmosphere to minimize the impact of global warming. Still, it is also being encouraged to develop more technologies that optimize renewable energy sources to depend less on generation sources that depend on fossil fuel sources. However, since this technology is recent, it faces challenges and dilemmas to be implemented not only for its operation but also for its safety. Therefore, two factors contribute to this area: optimization and security.
The importance of security in electrical systems is vital since the functioning of modern society depends on them. Failures in "electrical energy supply could cause severe consequences in hospitals, the industrial sector, airports, telecommunications, etc." [3]. Furthermore, because an SG incorporates data processing and is connected to networks, hackers may attack and destabilize a government or a private company. Also, there is an incorporation of the Internet of things (IoT) that applies to electrical systems. Rabelo et al. [3] state that the "IoT is a heterogeneous network involving different devices, such as electronic devices, mobile devices, industrial equipment."
Three features make IoT-based SGs vulnerable to cyberattacks. The first focuses on the many threats facing public sector organizations. For example, some threats are cybercriminals, political factors, or external terrorism. These threats intend to cause economic and security problems and take advantage of them. Second, expanding public sector companies have organizational and geographic complexity, including decentralized leadership in cybersecurity. The third is the interdependence of electrical systems with the physical and communications/Internet infrastructure. This interdependence makes them vulnerable to attacks and even physical destruction.
Recent examples of attacks on the electrical grid supply chain have involved cybercriminals. For example, a power plant in Saudi Arabia was reported to have compromised its security systems in 2017 [4]. Symantec claimed that the malware, Triton, took advantage of a Microsoft Windows operating system vulnerability [4]. Another example is a US pipeline system that transports fuel primarily to "the southeastern United States, suffered a ransomware cyberattack that" affected IT systems in 2021 [5]. In response, the corporation halted operations. "It was reported that within hours" of the attack, the corporation "paid a ransom of nearly 75 Bitcoins ($5 million) to hackers in exchange for a decryption tool" [6]. Another recent example illustrates the distributed denial of service (DDoS) attack. On June 10, 2021, the electric company in Puerto Rico announced that its customer portal and mobile application were victims of a cyberattack that interrupted customer access to its online services [7]. The DDoS attack generated 2 million hits per second to the customer portal and mobile apps, impacting many customers’ access to account information.
Literature Survey and Delphi Methodology
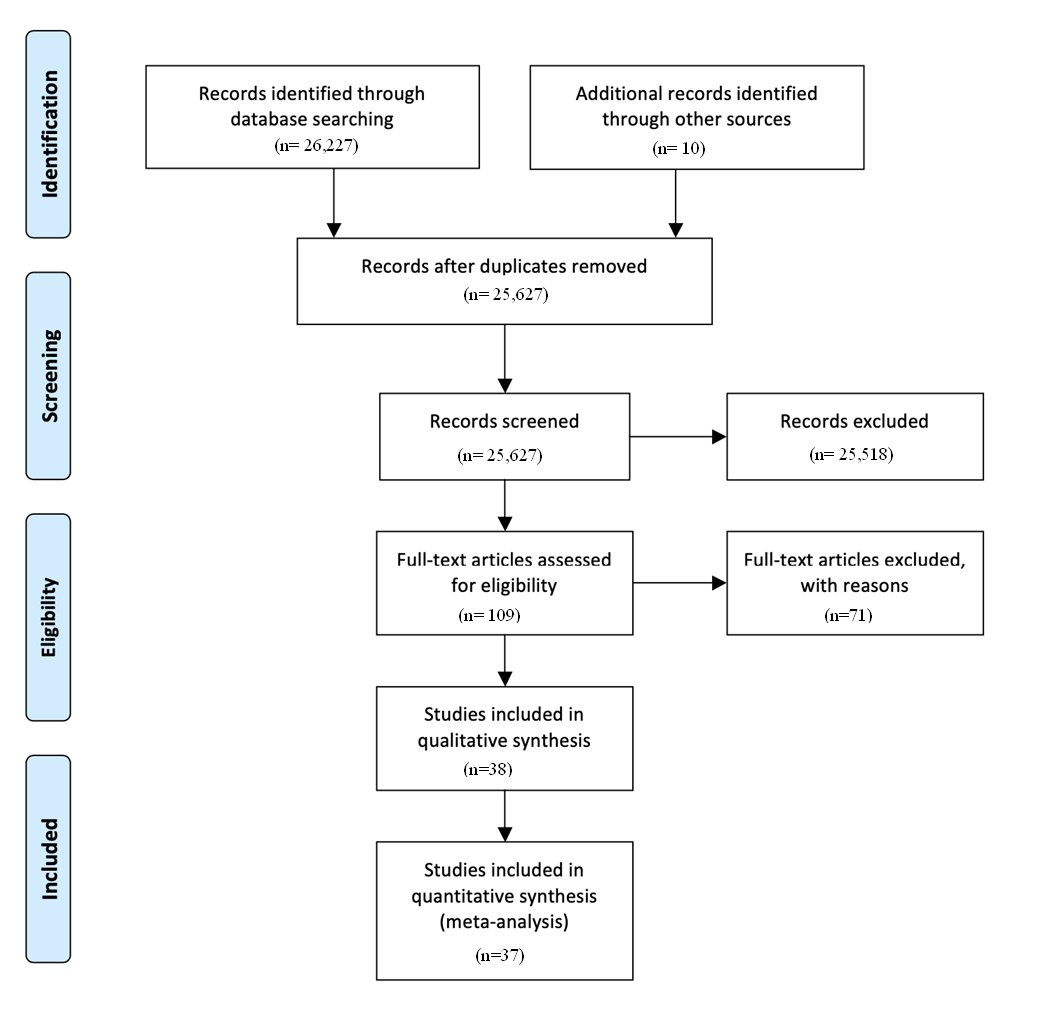
The literature survey used was PRISMA (Preferred Reporting Items for Systematic Reviews and Meta-Analyses). PRISMA’s Four-Phase Process (see Figure 2) assisted in identifying which articles explained risk management, defining characteristics of an IoT-based SG, and trends of a systematic methodology to study the propagation of malware in SGs and the consequent risk management. The articles were further screened to determine which papers were relevant and provided the level of detail required. Ten articles were added from other sources of the 26,227 articles reviewed from the different portals considered here. Therefore, the list was narrowed down to the top 30+ journal articles that will support this literature review. ProQuest ABI, Engineering Village, and Compendex provided the most selected review articles for this literature review, using search terms: SGs, Artificial Intelligence, Cybersecurity, Risk Management, System Dynamics, Multiple Resolution Modeling (MRM), Malware, and IoT.
The articles from the survey agree that the Internet of Things (IoT) is the evolution of the Internet [3], [8], [9]. An SG, considered one of the most critical infrastructures, is defined as the classical power grid augmented with a large-scale Information and Communications Technology (ICT) and renewable energy integration. Due to the number of devices and their relationships, this network can be considered one of the largest and most complex IoT networks. "The SG will involve billions of smart objects/things: smart meters, smart appliances, sensors, actuators-cars, etc., and several communication infrastructures, whether public or private" [10]. The IoT can be considered a dynamic global network infrastructure that intelligently manages self-configuring devices. Therefore, IoT is important for the implementation of SGs.
SGs are better than traditional legacy power grids in productivity and environmental friendliness [9], [10]. These SGs use many renewable energy sources, and above all, it is supposedly safer than the traditional electrical grid. The benefits of using an SG, in general, could provide a broader range of security with a good risk plan. Almost all research papers suggested that a threatening weakness for IoT-based smart grids could be the denial-of-service (DoS) attack [9], [10]. Given that SGs are networks, attacking the network would paralyze the smart network. SGs (composed of IoT devices) will need a good risk mitigation plan.
Moreover, concluding that self-awareness related to cyberattacks in SGs is important. The organizations should be aware of the risks related to the SG and mitigate them by doing various risk assessments and case studies to provide different solutions in protecting the SG against different types of cyber-attack. However, the literature review noticed a big gap: a lack of a systematic methodology to guide risk management. Therefore, simulation with system dynamics integrated with agent-based simulation in a Multiple-Resolution Framework (using mechanisms such as the High-Level Architecture (HLA)) can be resourceful. First, system dynamics can model the propagation and structure of the malware. Then, we can use agent-based modeling to simulate the operational environment and test mitigation strategies from those results in a hierarchical/distributed fashion.
This literature survey concluded that given the increasing penetration of IoT devices (e.g., IoT-based SGs), cybersecurity threats are rising. Furthermore, these threats are classified into three main categories: Malware, Exploit, and User practices [11] (see Figure 3). In addition, we decided to complement the literature survey with a Delphi process to identify the malware tendencies in IoT. The Delphi process will identify a specific family of malware that should be dominant in the attacks on IoT-based systems (e.g., IoT-based SGs).
Therefore, the Delphi method is performed to study the evolution of the threats in IoT-based systems. Delphi’s performance is based on the systematic use of professional opinions issued and agreed upon by experts. The Delphi process helps obtain information from different dimensions and perspectives on broad or specific topics and always looks to the future [12].
After, Delphi selected the malware family with the highest trend to disrupt SGs in the future (Mirai Botnet). It was decided to simulate the propagation of a member of the Mirai Botnet, the Satori Bonet) using System Dynamics. This demonstration explains in this paper some preliminary work that can be extended into more sophisticated systems and support more effective risk management frameworks. These future environments are introduced in the conclusions.
![General IoT Threats: Exploits, User Practice, and Malware (adapted and modified from [11])](fig3.png)
Rounds (Delphi)
Delphi is based on the fact that the forecasts of a structured group of individuals are very precise. Experts answer a group of questions in two or more rounds - usually three. After each round, a moderator summarizes the responses from the previous round. Then the experts continue reviewing their previous answers but now consider the summary of the answers from the previous round. This process is done until converging on a consensus response. As a result, the Delphi technique provided a reliable method for listing the most important malware to affect IoT.
Furthermore, it provided an opportunity for the researchers and the experts to cooperate, acquiring information that may have been undiscovered. The data collection process involved participation from expert practitioners from the industry environment of study and allowed for iterative refinement for consensus building among these participants [12]. Therefore, it is recommended to have between 7 to 15 participants.
We elected to examine the malware trends affecting IoT implementations such as IoT-based SGs. Nine experts from McAfee1, Norton2, and other cybersecurity consulting companies were selected. The experts were security Information Advisory Directors in 500 Fortune Companies, with an average experience of 20 years, malware investigators of the top firms in cybersecurity, and they had certifications from the top security agencies (e.g., CISSP (Certified Information Systems Security Professional), CISA (Certified Information Systems Auditor)).
Round 1
During this round, the nine selected experts were asked independently (using emails and Zoom sessions) to provide three malware that commonly attacks IoT devices and whose evolution could be dominant/pervasive in the future. These results are shown in Table 1, presenting the malware list and who selected each one.
| Experts | |||||||||
| 1 | 2 | 3 | 4 | 5 | 6 | 7 | 8 | 9 | |
| Bashite | \(\checkmark\) | ||||||||
| BrikerBot | \(\checkmark\) | \(\checkmark\) | \(\checkmark\) | ||||||
| Emotet | \(\checkmark\) | ||||||||
| Hydra | \(\checkmark\) | ||||||||
| Intel Spoiler | \(\checkmark\) | ||||||||
| Iot Troop / Reaper | \(\checkmark\) | \(\checkmark\) | |||||||
| Meltdown | \(\checkmark\) | \(\checkmark\) | |||||||
| Mirai Botnet | \(\checkmark\) | \(\checkmark\) | \(\checkmark\) | \(\checkmark\) | \(\checkmark\) | \(\checkmark\) | \(\checkmark\) | ||
| Moose / Elan | \(\checkmark\) | \(\checkmark\) | |||||||
| muBot | \(\checkmark\) | ||||||||
| PsyBot | \(\checkmark\) | ||||||||
| Stuxnet | \(\checkmark\) | \(\checkmark\) | \(\checkmark\) | ||||||
| TrickBot | \(\checkmark\) | ||||||||
Round 2
The first-round results were summarized and delivered to the same 9 experts in this second round. These experts were asked (independently) from that first-round list to choose the 5 malware they believed would be most common in the IoT environment and their ranking. In this Table 2, we show the results of this round of Delphi that was advancing at each step, and still, in this second round, convergence was not achieved.
| Experts | |||||||||
| 1 | 2 | 3 | 4 | 5 | 6 | 7 | 8 | 9 | |
| Bashite | 5 | 1 | |||||||
| BrikerBot | 2 | 3 | 5 | 5 | 4 | ||||
| Emotet | 1 | 4 | |||||||
| Hydra | 3 | 2 | |||||||
| Intel Spoiler | 2 | 5 | 5 | ||||||
| Iot Troop / Reaper | 4 | 3 | 4 | ||||||
| Meltdown | 1 | 3 | 5 | ||||||
| Mirai Botnet | 3 | 4 | 5 | 2 | 4 | 3 | 2 | 1 | 3 |
| Moose / Elan | 1 | 1 | 3 | 1 | |||||
| muBot | 2 | 5 | |||||||
| PsyBot | 1 | 2 | |||||||
| Stuxnet | 4 | 5 | 4 | 2 | 1 | 3 | 2 | ||
| TrickBot | 4 | ||||||||
Round 3
The experts were provided with the list and a summary of the rankings from Round 2. Then, they were asked to identify the malware with the greatest potential impact in the third round. Most experts agreed that the Mirai Botnet malware and its variants would be the most damaging and common. The results of this round are shown in Table 3. So it was decided not to continue with a fourth round since there was a majority.
| Experts | |||||||||
| 1 | 2 | 3 | 4 | 5 | 6 | 7 | 8 | 9 | |
| Iot Troop / Reaper | \(\checkmark\) | ||||||||
| Mirai Botnet | \(\checkmark\) | \(\checkmark\) | \(\checkmark\) | \(\checkmark\) | \(\checkmark\) | \(\checkmark\) | |||
| Stuxnet | \(\checkmark\) | \(\checkmark\) | |||||||
Delphi Summary
The selected type of malware was the Mirai Botnet family. This botnet attacks IoT devices. With the continuous integration of the Internet of Things (IoT) and increasing device connectivity, threat actors continue to focus their efforts against information technology (IT) networks. Furthermore, this study will also be important to incorporate more advanced schemes to develop risk management methodologies with more quantitative technologies, such as the simulation of potential threats beyond the dominant qualitative nature.
Mirai Botnet
With the Mirai Botnet and its variants, DDoS attacks can be carried out, which the literature survey also indicated as one of the most common forms of attacks on IoT-based SGs. The Mirai Botnet was created and deployed in 2016-2017 [13]. The Mirai Botnet has been attacking various targets for different periods, where it has turned hundreds of thousands of IoT devices into remotely controlled bots. In addition, several variations have emerged in recent years (2017-2022) that have improved the infection process [13].
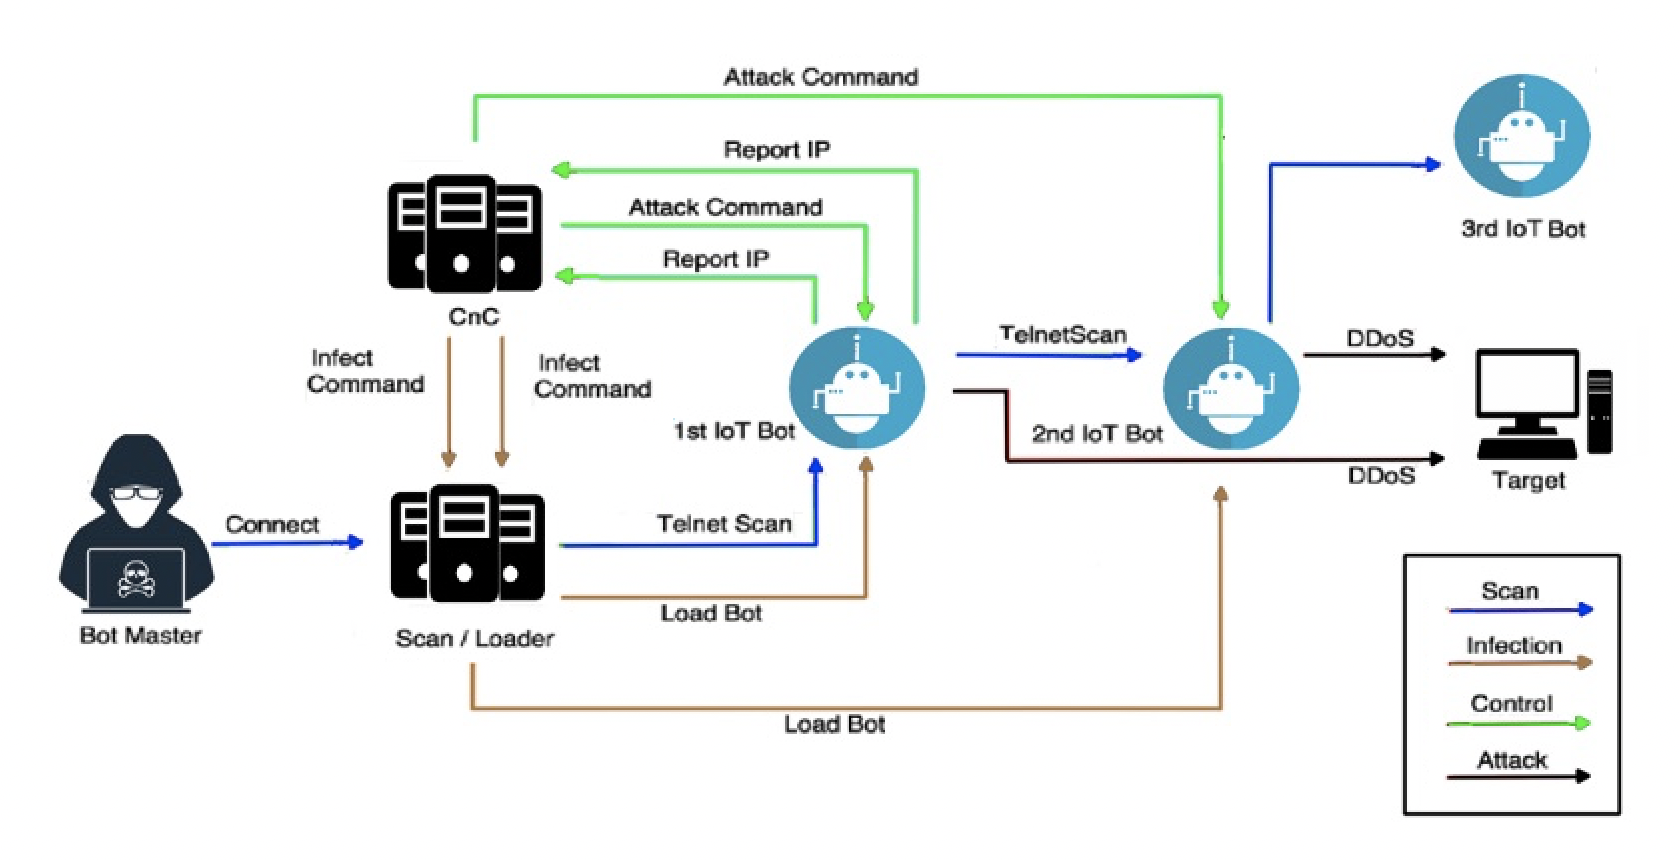
The sequence of events of the Mirai Botnet malware is explained below (Figure 4):
The Bot Master starts running the module’s scanner in the Scan/Loader server. The emphasis of the scanning is to look for vulnerable IoT devices with open Telnet ports. Therefore, the Mirai Botnet spreads by starting a quick scanning phase. First, it sends inquiries to pseudorandom "IPv4 addresses on Telnet TCP ports 23 and 2323" [14]. If the Mirai Botnet finds a susceptible IoT device, it enters a brute-force login phase. Next, it attempts to create a connection using several username and password pairs selected from a list. Finally, Mirai sends the infected device’s IP and credentials to a Command & Control (CnC) server at the first successful login.
The Scan/Loader server will use this information later to start the session. Next, an infection "command is sent from the CnC server to the Scan/Loader server, containing all the necessary IP addresses" [3]. Mirai supports multiple hardware architectures. The Scan/Loader server uses this information to log in and instructs the vulnerable device to establish a connection and download and run the binary file. Once executed, the first infected IoT device becomes part of the Mirai Botnet and can communicate with the CnC server. The strategy to avoid detection is to remove the binary file and only execute it within memory. The botmaster can now issue attack commands, specifying the attack duration and target parameters. The malware includes ten types of DDoS attacks that can attack another user on the Internet.
The first bot attempts to repeat the infection process and spread the botnet by scanning the Internet for additional exposed IoT devices. The new device information is sent back to the CnC server. Another infection command is issued to the Scan/Loader server. Then, the binary file is uploaded to the newly discovered IoT device. The exploration for other IoT devices is repeated to grow the botnet.
In the last 5 years, many variants of the Mirai Botnet have appeared since the source code for the Mirai Botnet was released publicly [13]. Furthermore, it has increased into more than 60 variants since it burst onto the scene with a massive Distributed Denial of Service (DDoS) takedown in 2016 [15]. However, the most important lesson learned is that IoT devices still pose a security concern. The IoT ecosystem, such as the IoT-based SGs, remains an easily accessible target for attackers.
System Dynamics and Modeling
System Dynamics can be used to model malware. This modeling can support the development of risk assessment strategies. For this research, the utilization of System Dynamics was studied to build a model for one of the recent variants of the Mirai Botnet.
System Dynamics: Causal Loops, Stocks, and Flows
The evolution of real-world systems can be studied using one of the simulation modeling paradigms: System Dynamics [16]. Rabelo et al. [17] state that the "central concept is that all objects in a system interact through causal relationships. These relationships emerge through feedback loops, where one change in one variable affects other variables; these variables, in turn, affect the original variable, and so on." These relationships form the structure of a system.
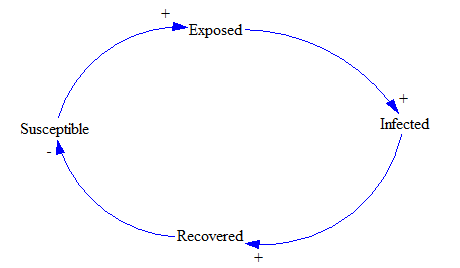
Creating a complete model in System Dynamics requires identifying the causal relationships of the system. Causal loop diagrams are important tools to represent these causal relationships. A causal loop diagram consists of variables connected, indicating the causal influence [18]. System Dynamics has been used to model infectious diseases, and the same models are used to model malware behavior [19]. The SEIR (’Susceptible’, ’Exposed’, ’Infected’, ’Recovered’) model is an example of one. Figure 5 depicts the basic causal loop for the SEIR model. Arcs connect the model variables, and the +/– signs indicate the polarities. For instance, as the number of Susceptible increases, Exposed increases, and the polarity (positive) is shown as a +. Likewise, as the number of Exposed devices increases, the number of Infected devices increases (positive polarity). However, as the number of Infected increases, the number of Recovered (positive polarity) increases. As the Recovered increases, the number of Susceptible decreases, denoted by a – (polarity is negative). In this way, complex diagrams can be built to represent the system under investigation and a good approach for knowledge acquisition.
Then we can develop a configuration of stocks and flows. Stocks are accumulations, for example, of IoT devices that indicate the system’s state. For instance, Infected is a stock that indicates the number of infected IoT devices at a given time. Flows are rates that add to or subtract from a stock. Again, mathematical equations can represent this graphic description.
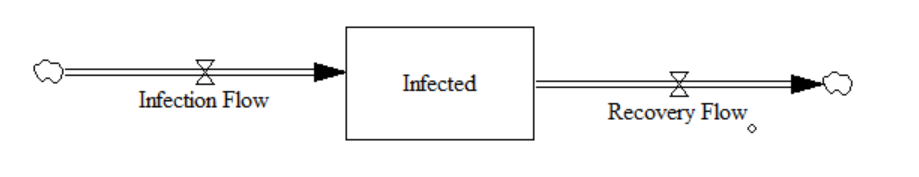
Figure 6 has two flows. The inflow is Infection Flow, and the outflow is Recovery Flow. The stock is Infected, and so this diagram can be represented by the Equation 1.
\[ \frac{dInfected}{dt} = InfectionFlow - RecoveryFlow\]
The relationships between each system element, such as stocks, flows, and auxiliary variables, can be described mathematically. So, the structure of a System Dynamics model is a system of nonlinear first-order differential and integral equations.
Modeling of the Satori Botnet
The Satori Botnet belonging to the Mirai Botnet family was selected for our initial modeling [20]. This botnet was used in several campaigns in 2018 [21].
The differential equations from 2 to 5 were initially utilized to model this propagation. These equations represent a modified SEIR model for the Mirai Botnet [19]. There are 4 differential equations (non-linear) where the stocks are:
Sis a stock and represents the Susceptible population of IoT devices.Eis stock and represents the Exposed population of IoT devices.Iis stock and represents the number of Infected IoT devices.Ris stock and represents the recovered IoT devices.
The first-order differential equations are presented in Equations 2 to 5:
\[ \frac{ds}{dt} = \lambda (1-\gamma) + \mu R(t) - \frac{\alpha I(t)S(t)}{N(t)}- \Phi_{3}S(t)\]
\[ \frac{dE}{dt} = \frac{\alpha I(t)S(t)}{N(t)} - (\beta+\Phi_{2})E(t)\]
\[ \frac{dI}{dt} = \beta E(t) - \Phi_{1}I(t)\]
\[ \frac{dR}{dt} = \lambda \gamma + \Phi_{1} I(t) + \Phi_{2}E(t) + \Phi_{3}S(t) - \mu R(t)\]
\(N\) is the population of IoT devices of that ecosystem at the time t calculated with the Equation 6.
\[ N(t) = I(t) + E(t) + S(t) + R(t)\]
Some parameters define the dynamic behavior of the malware. \(\alpha\) is the contact rate (see Equations 2 and 3). \(\beta\) is the infection rate and controls the rate of spread (see Equations 3 and 4). It represents the probability of transmitting the malicious load between a Susceptible and Infectious device. mu is the rate from Recovered to Susceptible. \(\gamma\) is the recovery rate (see Equations 2 and 5). For the SEIRS model, \(\mu\) is the rate at that recovered individuals return to the susceptible state due to loss of immunity (see Equations 2 and 5). \(\lambda\) is the growth of new IoT devices in the ecosystem (see Equations 2 and 5). \(\Phi_{1}\) is the rate from Infected to Recovered (see Equations 4 and 5). \(\Phi_{2}\) is the rate from Exposed to Recovered (see Equations 3 and 5). \(\Phi_{3}\) is the rate from Susceptible to Recovered (see Equations 2 and 5). The model tries to predict how malware spreads, the total number of infected IoT, or the duration of a campaign, and to estimate various parameters such as the reproductive number.
Therefore, we implemented this modified SEIR model in System Dynamics to capture the structure of the Satori Botnet. However, there is one problem with this: You need to capture enough data to obtain the different transfer rates (e.g., \(\alpha, \beta, \gamma, \mu, \lambda, \Phi_{1}, \Phi_{2}, \Phi_{3}\)). Unfortunately, after researching and viewing dozens of articles and even talking to Cybersecurity labs, the necessary data could not be obtained. So, we decided to search for information about the variants. Finally, it was possible to find enough information about the Sartori Botnet. In addition, we decided to use the SIR model (a variation of the SEIR), which has only three differential equations due to three stocks: Susceptible (Equation 7), Infected (Equation 8), and Recovered (Equation 9).
\[ \frac{dS}{dt} = -\frac{ContactRate * SI}{N} - (S * FactorfromSusceptibletoRecovered)\]
\[ \frac{dI}{dt} = \frac{ContactRate * SI}{N} - (I * FactorfromInfectedtoRecovered)\]
\[ \frac{dR}{dt} = (S * FactorfromSusceptibletoRecovered) + (I * FactorfromInfectedtoRecovered)\]
The Satori Botnet campaign to be modeled was the one that started on June 15, 2018. That day saw an increase in malicious scanning, and the Satori Botnet infected various IoT devices, peaking within 24 hours at approximately 2,500 attackers [22].
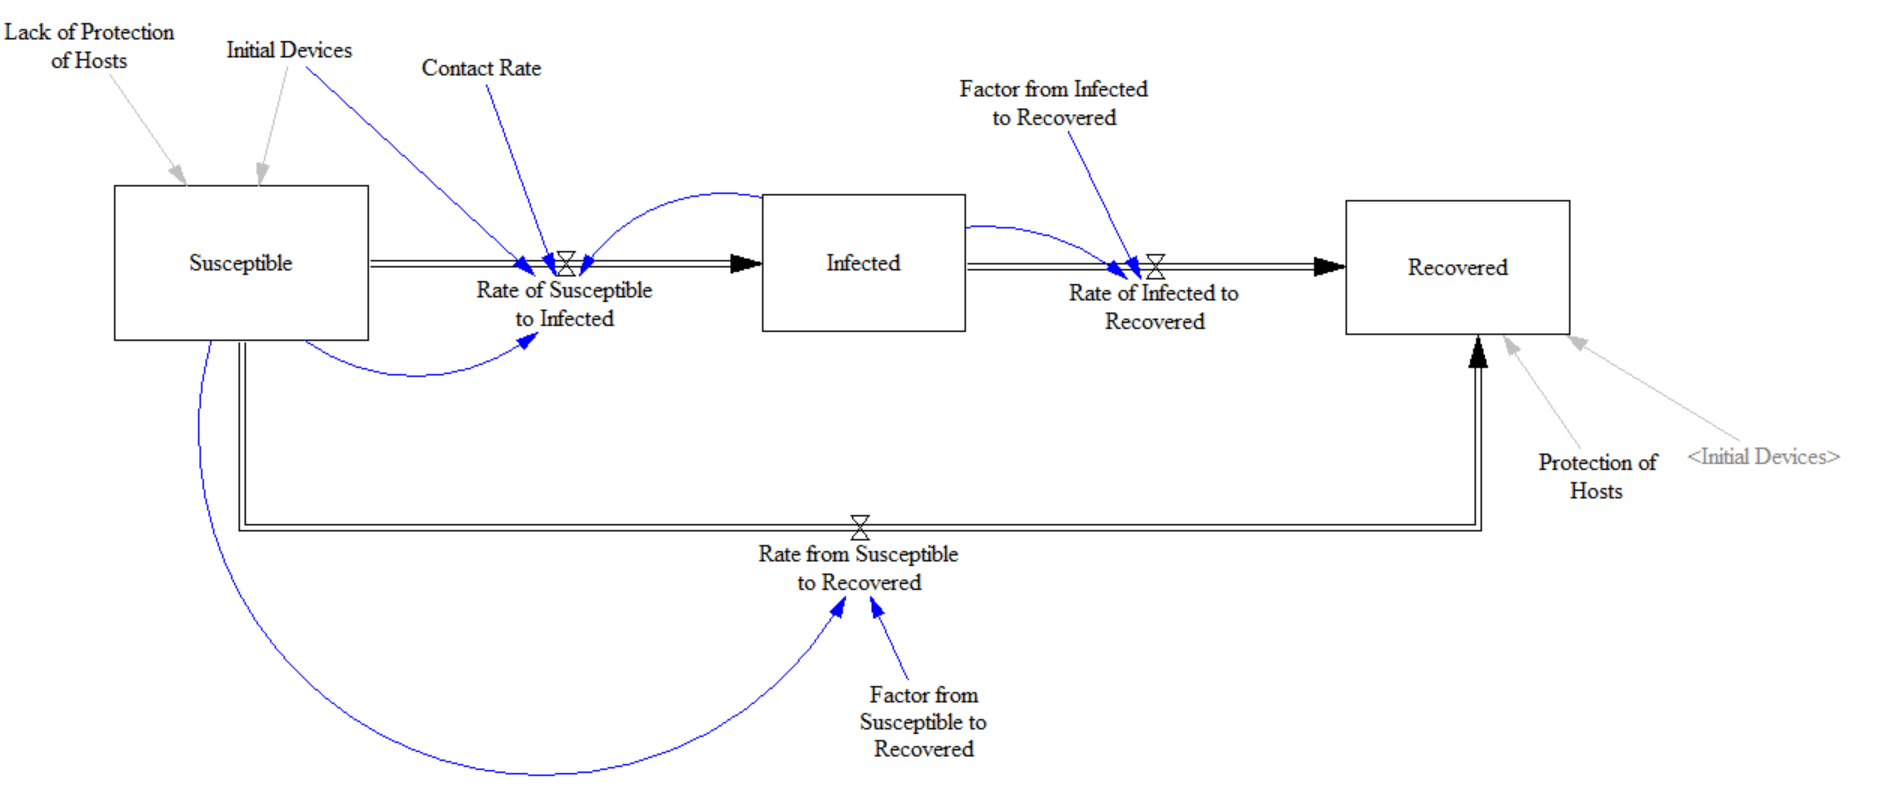
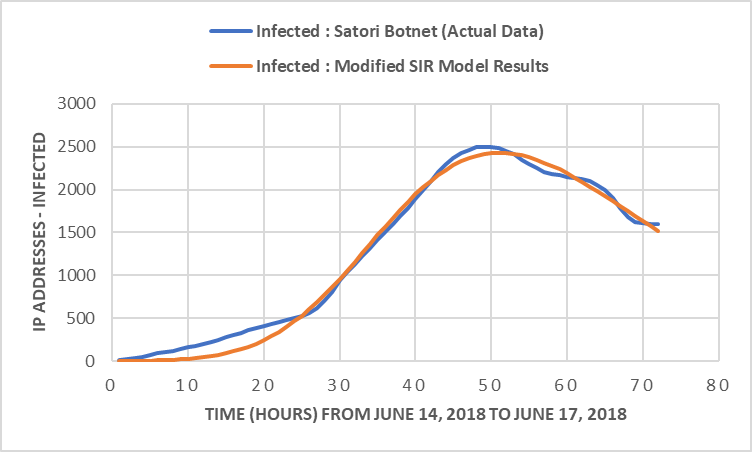
We calibrate the SIR model using Markovian Chain Monte Carlo (MCMC) stochastic optimization [23]. This calibration was to obtain transfer and contact rates. Figure 7 shows the System Dynamics model that has the three stocks. Figure 8 shows the model output for the Infected stock and compares what happened with the Satori Botnet. This reproduction of the Satori Botnet attack is of very excellent accuracy. The parameter to obtain from the stochastic optimization was the Factor of Susceptible to Infected. Therefore, MCMC found a value of 0.033/hours for this factor. Likewise, MCMC found the Factor Infected to Recovered that resulted in 0.5/hours.
The Contact Rate is another critical value that has to be found. MCMC found it to be 0.45. This value is expected due to the weaknesses of the respective ecosystem. For its part, Figure 8 presents the results of the model. The blue curve is the actual Satori Botnet, and the orange curve depicts the model’s results.
This model can provide more information by adding more structure and sensitivity analysis. In addition, the calibration of the model helps validate the structure.
Attack Threshold Scenarios
Many scenarios can be studied, having already calibrated the model. For example, a scenario could be studying a monitoring strategy using an Attack Threshold (limit). Thus, attack activities that aim to infect IoT devices can be detected. This "Attack Threshold" is the number of unique IP addresses within a time interval (and we can even simulate the delay in obtaining the number of IPs). If the number of IPs is higher than the threshold, it could indicate an attack in progress. So, a sudden increase in unique IP addresses within a certain period could indicate that a DDoS attack is underway. This implementation can be done with a honeypot system [24]. The monitoring organization can display statistics through dashboards with the respective metrics in real-time.
A honeypot is a group of computers or an information system designed to imitate potential targets of attacks. This way, a cybersecurity team can detect attacks. Honeypots can be used to divert these attacks from a legitimate target. Honeypots are a deception technology with which the behavior patterns of attackers can be understood. Security teams can use honeypots to investigate Cybersecurity breaches. Honeypots "reduce the risk of false positives, compared to traditional cybersecurity measures, because they are unlikely to attract legitimate activity" [25].
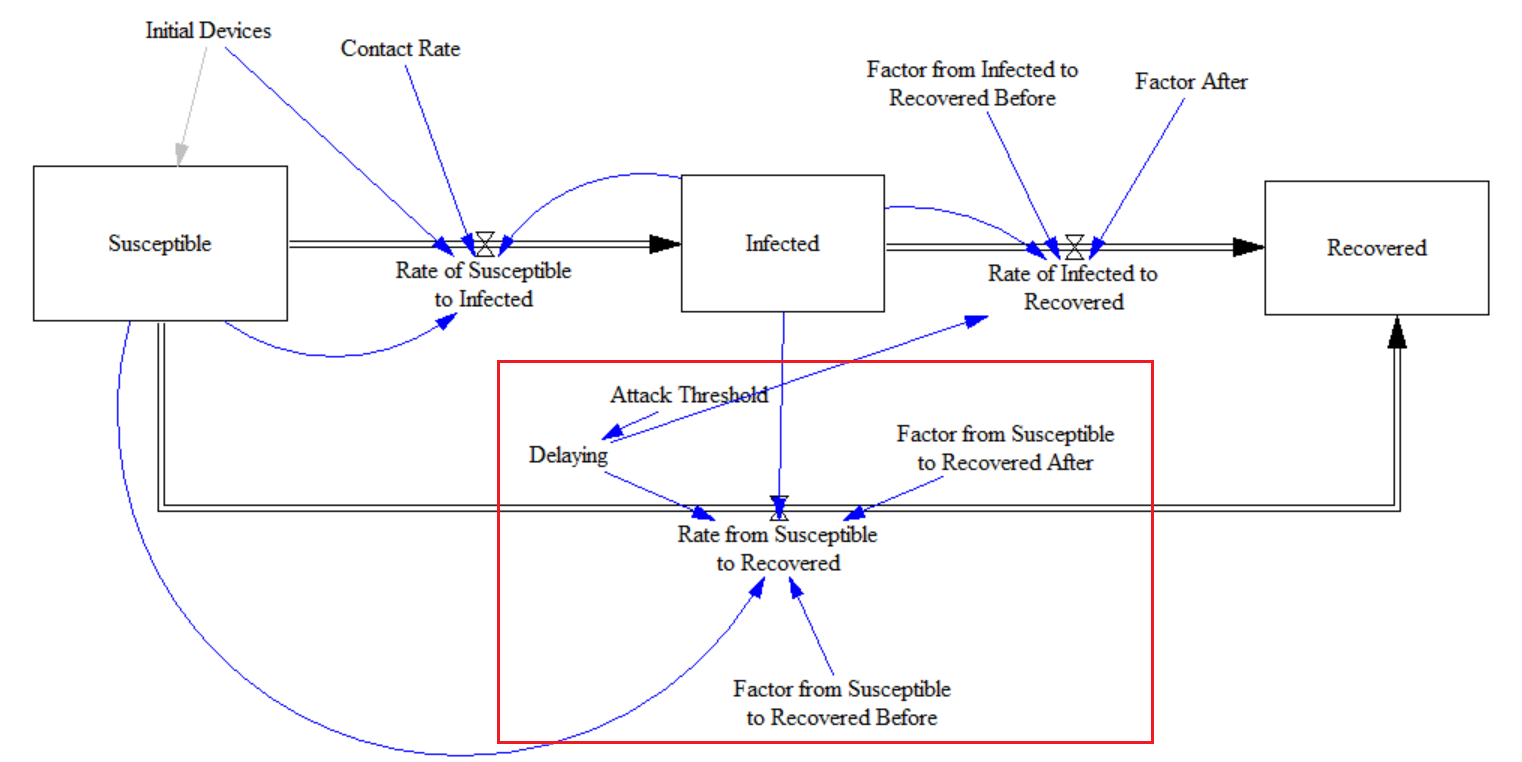
Figure 9 displays the modifications added to the original SIR model to study the Attack Threshold strategy. Again, two levels are compared, one with a threshold of 1000 infected IoT devices and the other with 1500 infected IoT devices.
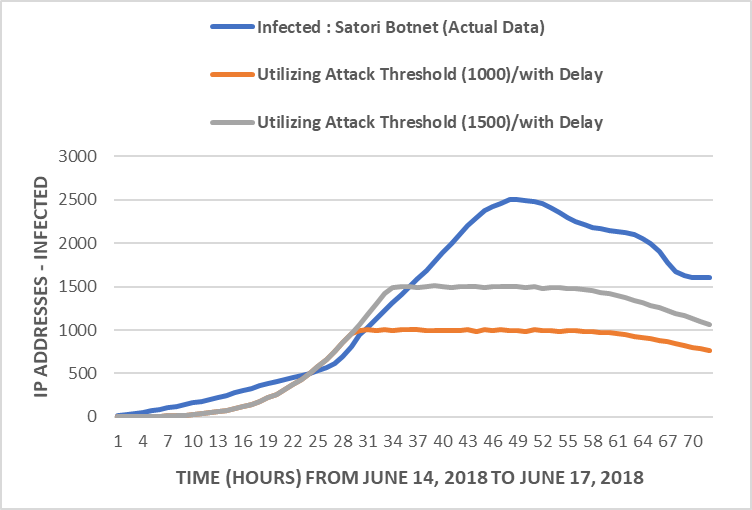
Figure 10 shows the results for the attack thresholds studied using the SIR model with some additions to implement the delay and the thresholds. The orange curve shows the reaction when it reaches 1000 infected IPs. The gray curve displays the results when the number of Infected reaches 1500 infected IPs. This approach has the potential to limit the potential harm from the malware.
Conclusions
Technological advances have provided important contributions to society in recent years. Even so, new dangers have also appeared, such as cyberattacks. Moreover, cyberattacks are becoming more numerous and sophisticated. As a result, traditional approaches do not work, and the imperative is to improve protection, refine prevention, and design adaptable/innovative mitigation approaches.
Literature Survey and Delphi
Based on experts from cybersecurity companies, it was possible to identify that the malware family based on the Mirai Botnet would be one of the principal threats to IoT-based Systems (e.g., IoT-based SGs), particularly with DDoS utilization. One area to explore more is ransomware [26], [27] which the literature has identified as important.
SEIR, SIR, and System Dynamics
This preliminary investigation built SEIR and SIR mathematical models to model malware propagation. These SEIR and SIR implementations were executed with System Dynamics and using numerical approximations with Euler as a solver. In addition, MCMC (i.e., stochastic optimization) was utilized to calibrate the model. This calibrated model can consider several scenarios related to the malware life cycle and potential mitigation strategies. Using System Dynamics is important because these models can be expanded by considering qualitative variables such as human behavior.
One of the scenarios studied with the SIR model is the difference that it makes to have the capacity to monitor an IoT-based system and identify unauthorized IoT devices. This mitigation strategy requires identifying IoT devices and evaluating real-time changes. Artificial Intelligence (particularly deep learning) can help with real-time monitoring [28]–[34]. The feasibility of this monitoring would be facilitated by including standardized methods for generating identifiers when manufacturing the IoT devices (and making this identifier more reliable than the message authentication code (MAC)).
Multiple Resolution Modeling (MRM) and Agent-Based Simulation
The model developed in System Dynamics is just a small step toward representing an IoT-Based SG. Simulation modeling of the IoT-based SG system will require different models. Different components such as SCADA and the network of sensors are critical elements. Therefore, a library of models, each representing the behavior of different types of malware and IoT devices, is essential. This environment that describes the SG (viewpoints: static and dynamic) can be built using a multi-resolution modeling (MRM) scheme [35], [36]. Different models can be added, even those that could model the consequences of the malware in SGs, such as high voltage peaks or reactive energies.
Several elements must be simulated. For example, an extensive remote monitoring protection system, cloud-based protocols, and mitigation approaches are essential. They are different models acting at different time resolutions implemented using the most appropriate simulation modeling paradigm. For example, agent-based simulation can model several components where actors/agents are important (e.g., an actor/agent can be a botmaster) [37]. MRM can assemble these different models required for modeling SGs. For instance, high-resolution first-principle models are suitable for the equipment level. However, building high-resolution models with insatiable data demand is expensive, time-consuming, and often not available or unreliable [36]. MRM allows hierarchies where different levels of abstraction reside. The flexibility of different abstraction models is that they will permit a variety of configurations to fit the requirements demanded by the type of questions to be answered by the simulation.
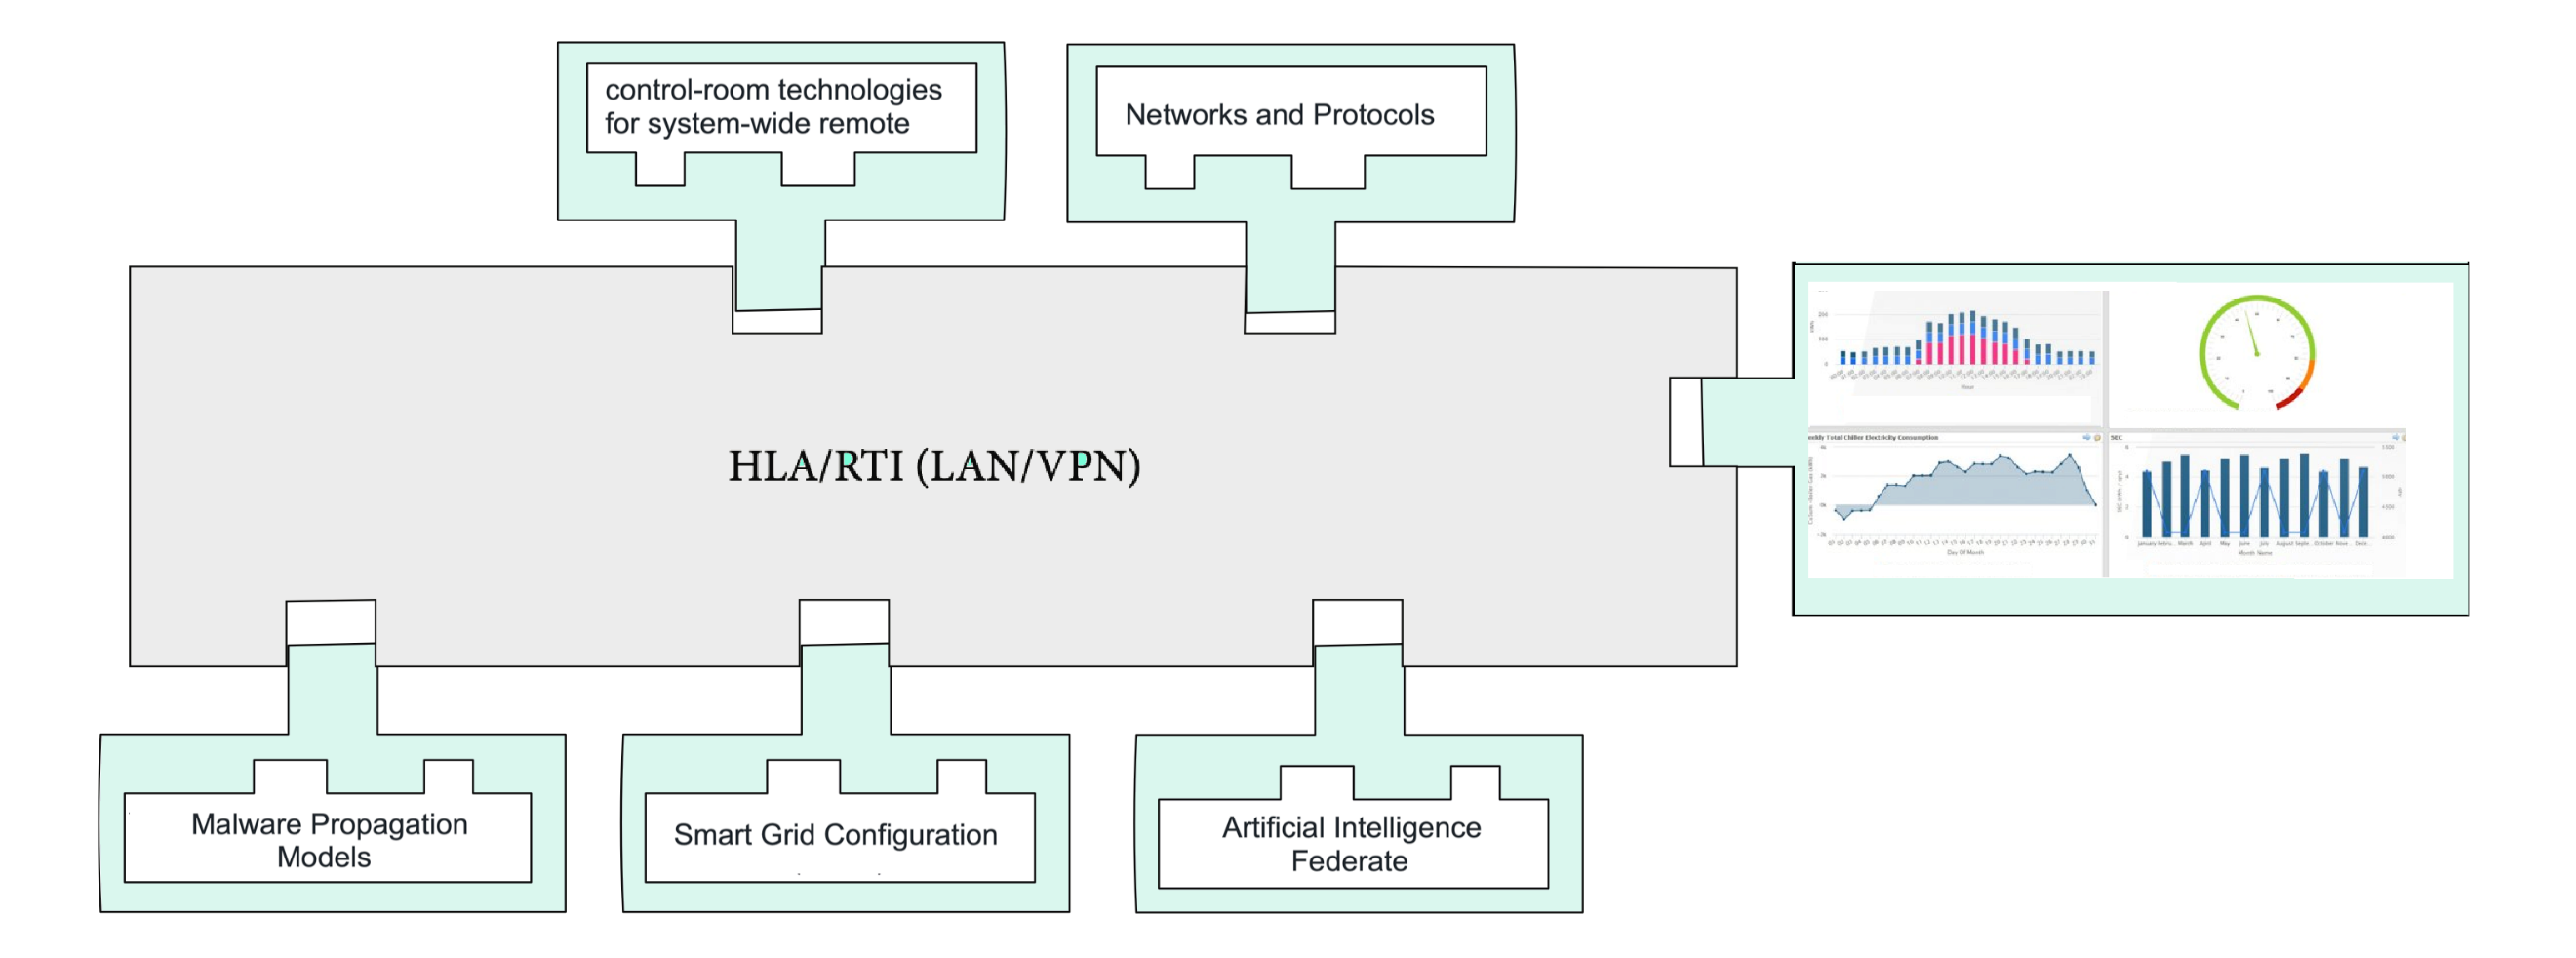
The modeling of IoT-based SGs required different levels of resolution from various dimensions of space, detail, time, space, and actors. Figure 11 shows a conceptual design of an MRM with different models as components for IoT-based SGs with an emphasis on cybersecurity. This design uses the High-Level Architecture (HLA) as a standard and the respective implementation in the Run-Time Infrastructure (RTI) to coordinate the time, space, and logic of the different models/components. This conceptual architecture can be implemented using a Virtual Private Network (VPN) that ensures that multiple users can use the MRM on a Local Area Network (LAN). But also, the MRM can be in the cloud, and users can access it through a VPN.
Authors' Information
Luis Rabelo is a Professor in the Department of Industrial Engineering and Management Systems at the University of Central Florida (Orlando, Florida). He has written more than 300 articles in Conference Proceedings and Journals. He is recognized for his funded work in Distributed Simulation by NASA, US Space Force, Office of Navy Research, Lockheed Martin, and others. He is also a Professor at the Universidad Mayor (Santiago, Chile) in Cybersecurity Risk Management.
Andres Ballestas is a Colombian engineer graduated from the Escuela Colombiana de Ingenieria Julio Garavito and an M.S. in Engineering Management from Universidad de La Sabana. He is a recognized expert in Cybersecurity and has worked for Intel Corporation and McAfee.
Javier Valdez has several degrees in Electrical Engineering and Industrial Engineering from the Instituto Tecnológico de Ciudad Madero, Universidad Politécnica de Ciudad Victoria, and the University of Central Florida. He is currently a Ph.D. student at the University of Central Florida. His expertise is in Power Electronics and Cyberphysical Systems.
Bibi Ibrahim has a Ph.D. in Industrial Engineering from the University of Central Florida. She has a B.S. in Materials from the Instituto Tecnológico de Costa Rica and an M.S. in Industrial Engineering from the University of Central Florida. She has performed research in Deep Learning, Renewables, Energy Storage Systems, and System Dynamics.
Authors' Contributions
Luis Rabelo wrote most of the article and developed the system dynamics models. Also, he contributed to the part of Multiple Resolution Modeling.
Andres Ballestas developed the Delphi Rounds and provide expertise in Cybersecurity.
Javier Valdez developed the PRISM, literature survey, and expertise in IoT and Smart Grids.
Bibi Ibrahim provided guidance for the stochastic optimization of the article.
Competing Interests
The authors declare that they have no competing interests.
Funding
No funding was received for this project.