Introduction
Mobility is one of the biggest challenges in cities worldwide [1]. The traffic problems have become worse because of the increase in the number of private vehicles on roads in recent years and the reduction in public transport capacity as the city’s population grows. It generates affections such as traffic congestion, longer traveling time for the road users, and even affecting road safety. It is remarkable in Latinoamerican countries where most cities have been built disorderly and planned for a small population over the years [2].
Lately, the mobility experts have learned that data is a powerful tool for pinpointing and addressing the most pressing transportation issues [3]. The data helps officials to design measures reducing congestion and contributing to improve road security by helping them understanding the factors that cause accidents [4].
Data analysis of transportation allows traffic flow studies focused on the interactions among various traffic participants (e.g., vehicles, drivers, pedestrians, and bicyclists) and infrastructure (e.g., highways, signal control devices) aiming to reveal the relationship between individual traffic participants and the resulting traffic flow phenomena [5]. As a result, traffic flow studies are empirical studies that heavily rely on high-quality measurements of real data. The sensors technologies and cameras could provide a good quality information [6]; however, unfortunately in Colombia there is no technological connected infrastructure allowing obtaining real time data of vehicular flow and other variables to characterize the traffic flow.
The lack of availability sensors connected in Colombian cities to register mobility information makes it necessary to continue acquiring data by deploying available working teams. To develop a mobility study, they obtain variables like velocity, number of vehicles, traffic light times, among others. For this, it is necessary to design fieldwork based on good practices, which experts have proposed to capture the main indicators of the traffic flow and other mobility aspects [7].
Villavicencio is a city in the center of Colombia, where the Andes mountains meet Los Llanos plain at the southeast of Bogotá, which is the capital of Colombia. Similar to other cities, it presents an exponential annual automotive growth, generating greater demand for the existing road system. Villavicencio was born as a transit place for merchants, who needed to transport their products from the east to Bogotá. Therefore, the city presents a circular development with the center of Villavicencio as its starting point. In the center of the city, the government buildings, banks, and commerce are located generating greater demand in the road system of this area compared to other areas of the municipality [8].
Considering the above, this article presents a mobility study of the center of the Villavicencio, particularly focusing on the main avenue called Alfonso Lopez and two principal intersections; Carrera 33 with Carrera 29 and Carrera 33 with Calle 34. In this study, the plate method acquired the travel time and speed of the different transport modes at the avenue. Furthermore, the vehicular volume at the intersections and the traffic light times. The data and estimated traffic indicators allows proposing mobility solutions projected to 15 years. It has been supported by a simulation using the Syncrho software.
It is crucial to remark that the procedures and method, e.g., plate method used at fieldwork to acquire information, correspond to procedures previously proposed [9] and applied by the public transport agencies.
This article is structured as follows. Section 1 shows the Methodology, where the features of the study zone and the procedures used for data acquisition, indicators estimation, and simulation are exhibited. Section 2 corresponds to the Results, and it presents the main finding of this mobility study. Section 3 the main conclusions and perspective of this study for Villavicencio city in Colombia.
Methodology
This project is carried out with a mixed quantitative and qualitative approach, experimental, descriptive, explanatory, ending with a simulation model based on data collection on the observation of means of transport and speeds. The analysis seeks to establish the vehicular flow by means of transport deliberating in favor of the improvement or increase of the mobility of the existing traffic.
Taking as an object of study the avenue Alfonso López from the roundabout of the grass, including the park of flags, the length of the sections to be intervened was measured, and travel times and speeds were studied by the plate method. In addition, numerical methods referring to counts were used to evaluate the traffic volume, vehicle composition, and projection of the results.
Area under Study
The area under study is the avenuw Alfonso López from the roundabout of the grass, between two sections. Section 1 is Glorieta de la GRAMA to Carrera 33 with Calle 32, and section 2 returns in the opposite direction from Carrera 33 and Carrera 29 to the roundabout from the grass. These in turn were subdivided into 13 sub-sections, they are paved and have traffic lights (see Figure 1).
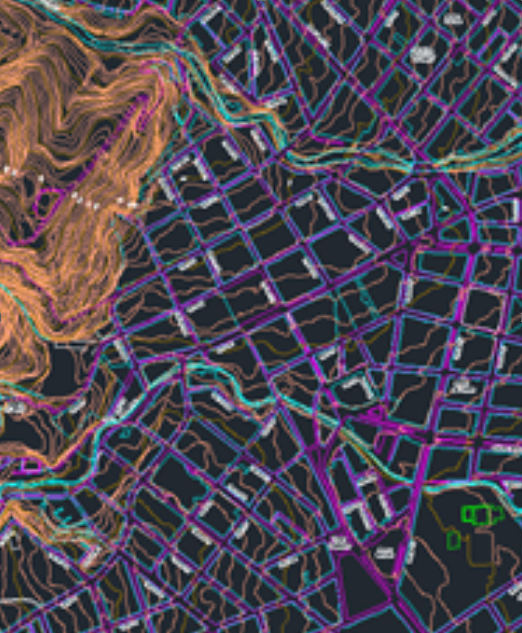
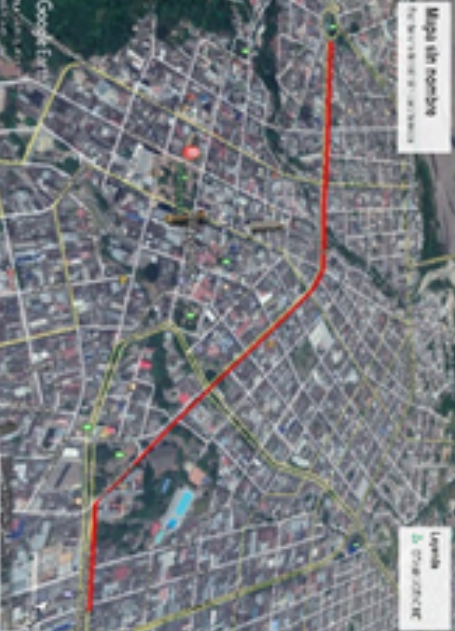
The two interceptions with the highest traffic flow from the meeting of Carrera 33 located in front of the courts and the merger of the Maizaro bridge were studied. It is a main road, which unifies the traffic from the Bogotá-Villavicencio road with the municipality through from highway 40 until the interception located in front of the Unicentro shopping center giving the possibility of connecting with the city center through the Maizaro bridge. It concludes in Carrera 33 at the interception to be evaluated.
Data acquisition
The data collection was carried out by means of procedures: the method of travel time and annotation of license plates, tabulation of information having as a guide the text of Cal et al. [9] (see Figure 2).
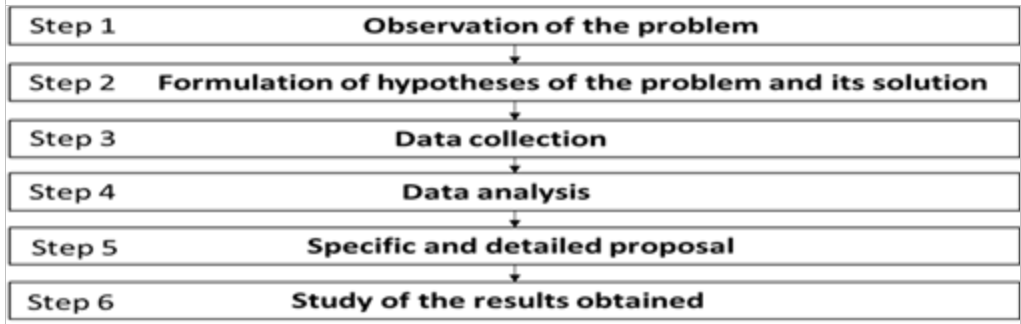
To achieve each of these steps, the following activities were done:
Taking vehicular and pedestrian counts in the study interceptions.
Analyzing the data collected in the traffic gauges and the information collected from the traffic congestion through the Google Maps application based on the information and observation collected.
Taking traffic light times and study of vehicle flow speeds in the study area.
Collecting and processing of data and information on the road section studied in different software.
Analyzing data based on the experience acquired in conducting civil engineering studies and through interviews with different mobility professionals.
Creating a solution based on the processed data and opinions of professionals in the mobility area to improve the mobility of the area under study by a high percentage.
The travel time methods in which the travel time between two established points is measured, taking into account the Colombian Traffic Code, in TITLE III "BEHAVIOR RULES", explicitly in CHAPTER XI "Limits of Speed" - "ARTICLE 106. SPEED LIMITS IN URBAN AREAS PUBLIC. Modified by art. 1, Law 1239 of 2008. Amended by art. 1, National Decree 15 of 2011 NOTE: National Decree 15 of 2011 was declared Inexpensive by means of Judgment of the Constitutional Court C-219 of 2011. On urban roads the maximum speeds will be sixty (60) kilometers per hour except when the competent authorities for signs indicate different speeds". It is important to bear in mind that the speed of this road should not exceed 60 km as indicated above.
Experimental design
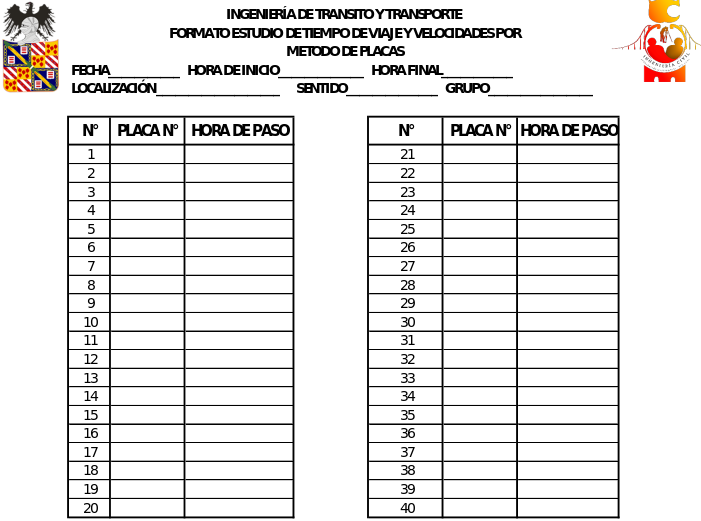
It was sought to know the distance of the sections under study through the odometer measurement of the two sections divided into thirteen subsections, and thus totalize their results. The information tabulation was done by hand using the format presented in Figure 3, where the last letter of the plate was written, with its respective number. With the help of the cell phone timer, the exact time in which the vehicle passed in front of the practitioner was recorded, and so on until obtaining the 40 data. It was held at the following times: off-peak time (8:30 am - 11:30 am; 2:30 pm - 5:00 pm), and peak time (7:30 am - 8:15 am; 11:45 am - 12:30 pm; 5:30 pm - 6:45 pm).
The travel time method and annotation of license plates were combined. The results of these two methods were obtained, then the data was tabulated. The concepts to be used, in the field, data on travel time and travel speed are obtained. Processes and procedures developed are travel time methods, in which the travel time between two established points is measured, for which the following methods are used:
Annotation of license plates: this procedure essentially consists of noting the moment and time in which the vehicles that travel a section of track pass through two or more points of the section identifying them by their registration plate. Then the travel time between the points of the road is calculated knowing the distances that separate them. It only measures travel times, it does not measure delays. Its efficiency depends largely on the number of vehicles that pass through the section considered because if the traffic is intense, an acceptable sample can be obtained in a relatively short time and vice versa.
Procedure for the practice: this was proposed in each control point. There are two gauges per direction for the registration of the plates that write down the last letter and the three numbers and the respective time according to traffic and transportation engineering.
It was continued with the other sub-sections of the two sections. With this technique, each sub-section of the two sections was systematized allowing in the next step to carry out a comparative analysis by days, daytime off-peak speeds versus the afternoon off-peak time, daytime rush hours versus the afternoon rush hours. Furthermore, this type of analysis allows locating the problems in the sub-sections and extrapolated to the sections, which will indicate the referencing of scenarios and possible specific solutions. In order to organize the field work, we opted to take more variables in order to make the comparison and broaden the horizon of the outcome scenarios. For this, the time elapsed by bus, private car, and taxi in each section was taken.
Next, the way to collect and tabulate the data is disclosed, through a format presented in Table 1, with their respective pictures for a better perception of the behavior of each variable. The behavior of each vehicle used to determine the total speed of sections 1 and 2 could be evidenced offering the possibility of proposing possible solutions.
| Sub-Section | Distance(m) | Time(s) | Speeds (Km/h) | ||
|---|---|---|---|---|---|
| Valley time day | Time(s) | Valley time afternoon | |||
| Bus | |||||
| Cab | |||||
| Particular | |||||
| Plate Method | |||||
In the last phase, the behavior of the cycle time of the traffic light and other aspects of the diagnosis of aspects necessary for the road projection of the intersections belonging to the area under study was made known. Then, we proposed a solution that satisfies the demand for the traffic volumes projected for a period of 15 years.
Regarding the behavior of the cycle time of the traffic lights, a physical review of the place was carried out denoting the different uses and types of land, as well as its spatial conditions of high densification. Also, we developed an intervention with a view for improving the fluidity of vehicles in the intersections through studies of vehicular traffic with the management of the times of green light in the traffic lights. It did not work, so the problem persists.
The data collected were the turns given by the vehicles in the 3 most representative times: from 9am - 10am, 4pm - 5pm and 8 pm-8:30pm. They are represented with bars followed by colors: red (time stopped) and green (time in motion), in order to show graphically which are the longest times at each of the two intersections.
With this measurement, it was possible to address the road projection of the weekly daily average traffic obtained as a result of the capacity taken during 2018. The Villavicencio Mobility Agency facilitated the single gauges and then the projection was carried out by linear method.
Now, with the observation of the study of speeds, we measured the speed that vehicles can develop on a road, its inverse, and the time it takes to travel a given distance using the format of Table 2. It is usually measured at a point or short section of a road to determine the speed with which vehicles pass through there, while the travel time is observed in sections of certain length to know the quality of the overall service they provide or its variations throughout them.
| Sector in measurement | |||||||
|---|---|---|---|---|---|---|---|
| License Plate | Car | Internal lane | External lane | ||||
| Time(s) | V(m/s) | V(K/h) | Time(s) | V(m/s) | V(K/h) | ||
| 1 | |||||||
| ... | |||||||
| 60 | |||||||
| Average | |||||||
It allowed us to recognize distances and speeds that were presented in the results, supported by the norms presented in the section Data acquisition.
Results
Travel Time Estimation
The fieldwork described above allowed collecting data related to the traffic flow using the license plate method. Data from each segment for both paths of the avenue Alfonzo López gave the mean velocity values for valley and peak times, as shown in the bar graphs presented in Figure 4. For path 1, the velocities at valley times were similar for all of the segments. In addition, the same behavior was presented for peak times. However, there are differences between the peak and valley moments. The speeds at the valley moments are more significant than peak one, which is expected due to the peak time is related to more traffic congestion. Valley times had an exception in roundabout of the Grama up to Calle 41 and Calle 32, which showed a higher velocity with respect in the other segments. It could be explained that the buses go down fast because this segment has no stops at this location. On the other hand, path 2 presented similar velocities for all segments except for Palacio de Justicia – Calle 35 and Calle 41 – Grama, which had higher speeds. Likewise, Calle 32 with Calle 33 exhibits an anomaly speed with lower velocities. It can be explained due to traffic jams generated by the cars from Avenue 40 (unicentro). It is crucial to consider that when traffic is slower along the peak hours during the day, people go to their jobs and studies. On the other hand, at night, the peak hours are due to the people usually return to their homes.
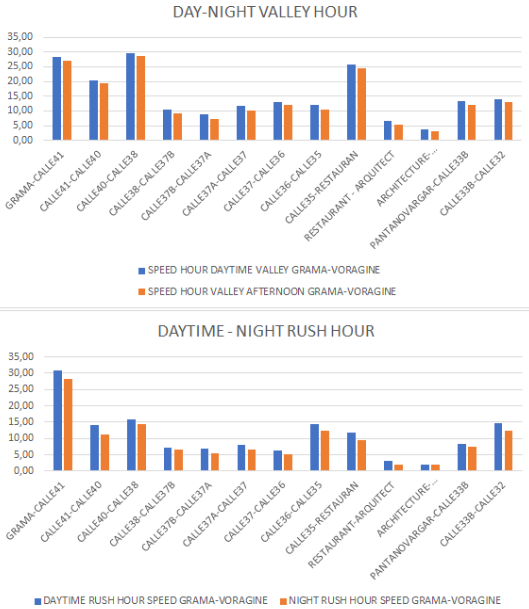
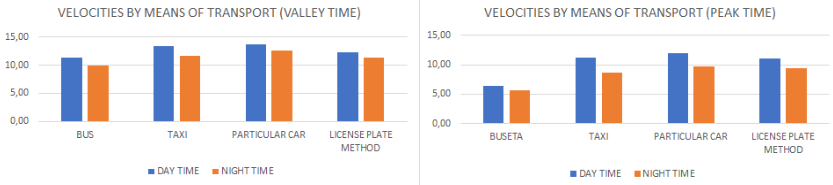
Figure 5 shows the type of vehicle versus velocity at path 1. The data related to the bus, taxi, and private car speeds show that the buses always present lower velocity. This is because buses are parking in different areas to wait for passengers, making mobility difficult and obstructing the road. On the other side, the speed obtained on the taxi route on occasions was more significant than the individual. In general, taxi drivers are more impatient and without enough caution to drive. In contrast, the driver is more careful and probably did not hurry to get the destination sometimes. The behavior of velocities as a function of the mean of transport was similar to path 2 is not presented here.
Traffic Flow Indicators at intersections
Volume of Vehicles
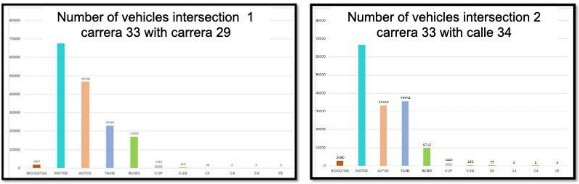
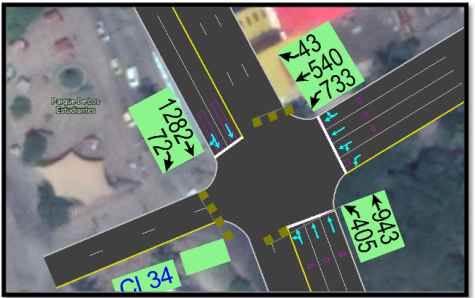
The evaluation of vehicular traffic at the intersections between Carrera 33, Carrera 29, and Calle 34 located in the municipality of Villavicencio allowed us obtaining the total volume of each type of vehicle including all movements for periods of 15 minutes, per hour, hourly and daily variation, maximum and minimum total volume for all vehicles per hour, and their composition in percentage. The indicators described above were estimated with their individual Peak Hour Factor. Figure 6 shows the vehicle volumes for periods of 15 minutes and by type of vehicle in one day. Additionally, the bar graph shown in Figure 7 exhibits an hourly variation of vehicle volumes.
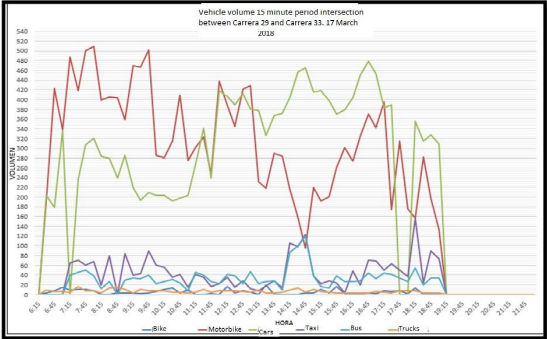
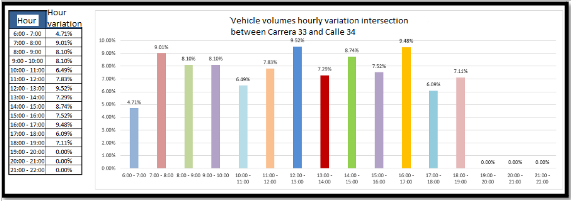
The results of vehicular volume for all days under study and at critical points of the intersections are presented in the Figures 6 and 7. It allows concluding that it is possible to identify the difficulty of mobility between the crossroads of the Carrera 33 when it crosses Carrera 29 (i.e., intersection 1) and Calle 33 with Calle 34 (i.e., intersection 2). Firstly, on the sidewalk with two lanes, which generates an impact on the other advancing movements and causes vehicular bottling. Additionally, movements 1 and 8 (described in section 2) from the intersection between Carrera 33 and Calle 34 show significant congestion on the traffic flow.
Furthermore, the number of vehicles at each intersection was acquired and was plotted as presented in Figure 8. It is demonstrated that motorcycles are predominant in both intersections under study.
Traffic Lights Cycles
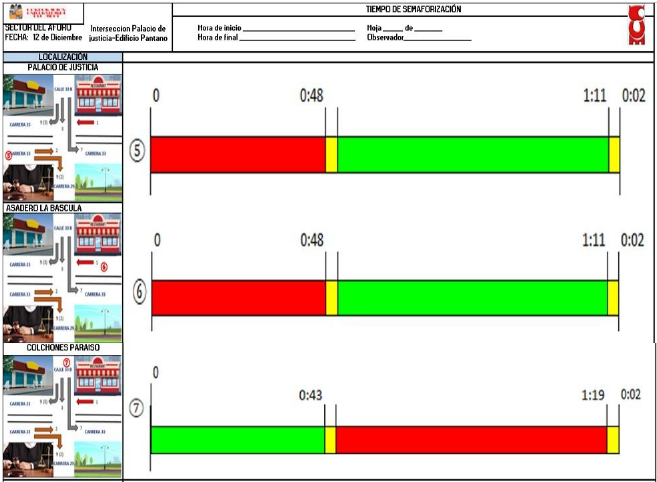
To study mobility, a valuation of the semaphore times was necessary for each intersection by phases. For example, intersection 1 located in Carrera 33 with Carrera 29 has four stages called 1, 2, 3 and 4 as presented in Figure 9. In contrast, intersection 2 located in Carrera 33 with Calle 34 has three stages called 5, 6, and 7 as presented in Figure 10.
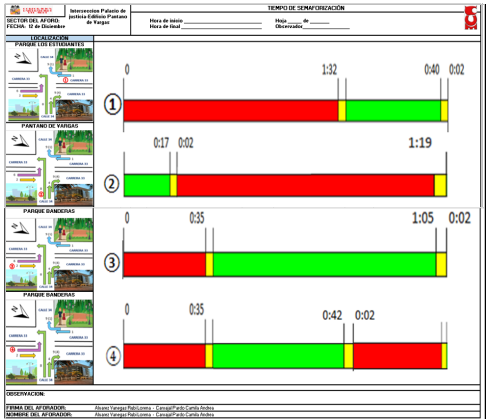
Figure 9 shows the scheme of phases and time belonging to intersection 1. The most prolonged phase was on the third and fourth phases at Carrera 33 with Centro and Barrio Barzal. Likewise, it is possible to see that the second phase located in front of Pantano de Vargas building has a section with less time in green than in red. On the other hand, in the four phase, it is possible to appreciate a similarity of seconds and the average totality of the cycle yellow is 106 seconds at intersection 1.
For the intersection 2, phases 5 and 6 located in Carrera 33 in double direction are synchronized and more prolonged in 120 seconds. In the same way, it was possible to observe that the seventh phase located in Calle 33b corresponds to the section with less time and has a duration in green of 71 seconds. Furthermore, in the three phases, it is possible to appreciate a similarity of seconds in yellow light and the average totality of the cycle for the intersection is 120 seconds.
Figure 10 shows the scheme of phases and time belonging to intersection 2.
Mobility Modeling
Modeling current mobility from the information collected in the fieldwork allowed having the inputs for the modeling through the Synchro software described in the section 2. It is crucial to establish the essential characteristics of road geometry such as length and angle of each lane, vehicle flows per lane and permitted turn for modeling. As presented in Figure 11, the software calculates the saturation flow with this information, representing the traffic flow and the allowed turns.
The vehicular flow refers to the values raised one day corresponding in this study to the data collected at fieldwork for July 1 2018, which is a day representing a maximum vehicular volume of 4.018 from 11:30 am to 12:30 pm.
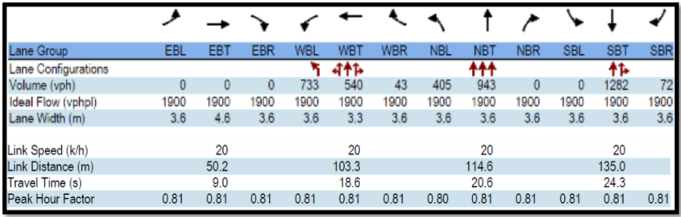
Figure 12 shows the allowed turns of each lane (lane configurations), the vehicular volumes used (vph), saturation flow (vphpl), lane width, speed (link speed), distance from the lanes (link distance), travel time, peak hour factor for the day July 3 2018, and the last indicator corresponds to the utilization factor of the intersection of Carrera 33 with Calle 34 called Parque Los Estudiantes - Edificio Héroes del Pantano de Vargas.
The models give the estimated saturation flow for all of the lanes of intersection 1. It shows that this has 1900 vehicles per hour comparing this value with each one of the data entered of the vehicular flow per turn. Thus, it is possible to determine that the route works with a lower saturation flow calculated as the volume limit of the lanes. Finally, for intersection 2, the modeling is performed and the results are comparable with intersection 1.
Level of Service
To model mobility, it is crucial to consider the service level of a road. This category explains how an intersection works and how much additional capacity is available to handle the traffic fluctuations. This classification is estimated using protocols (Highway Capacity Manual, 2010) and permits the analysis of the conditions expected at the intersection. Figure 13 represents the service level at each intersection in the moment of this study.
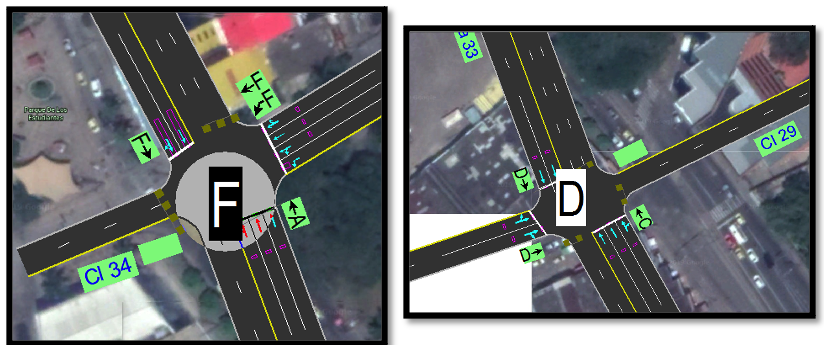
The analysis showed that Carrera 33 with Calle 34 (intersection 2) north to south is at service level F. This level of service F represents forced flow conditions. This situation occurs when the amount of traffic that approaches a point or roadway exceeds the amount that can pass through it. In these places, queues are formed where the operation is characterized by extremely unstable stopping and starting waves. Therefore, location indicates that the level of service is deficient, representing that these rails are at the limit. On the other hand, Carrera 33 from south to north presents an acceptable service level in classification A.
The intersection Carrera 33 with Carrera 29 (intersection 1) at La Bascula - Juzgados Restaurant presents a general level of service D. The level of service D represents a circulation of high density. Speed and freedom from maneuvers are severely restricted, and drivers experience a low general level of comfort and convenience. Small increments in the flow usually cause problems with functioning. Additionally, the intersection of Carrera 33 with Calle 34 is on a service level F. It means the intersection is not working optimally and it represents adverse effects on mobility and therefore, on user’s daily lives.
Mobility Solutions Analysis
Based on the previous results supported by the software Synchro and considering the experiences of other projects, three models of a solution have been proposed and analyzed to improve the mobility in intersections 1 and 2.
Solution 1: Optimize the Semaforization Cycles. At the moment, the signalized time of the La Bascula-Juzgados Restaurant intersection has 120 seconds, while the cycles proposed by the Synchro software have a duration of 70 seconds. The modeling shows that this solution improves from F to E in some lanes in the entire zone under study. Therefore, it was determine that optimizing only the signalization cycles is not an efficient solution.
Solution 2: Exchange the Type of Intersections. The solution was discarded because its implementation depends on the additional space required to expand the network in the area under study. This proposal would also have a representative negative impact on citizens’ daily lives because it will be necessary to close the intersections to built the roundabouts. In addition, it would demand buying buildings, which would be a great inconvenience. This route is of great importance for the connectivity that the center represents with a large part of the city.
Solution 3: Implementation of new lanes. This proposal seeks to increase the road capacity and thus improve the level of service reducing travel times and improving users’ convenience. These lanes will be located in:
Carrera 33 north to south, between Calle 34 and Carrera 29.
Calle 29 west to east, between Carrera 34 Bis and Carrera 31A.
The objective is to expand the road mall, which impacts the optimization of the traffic lights cycles resulting from a decisive improvement in the level of road infrastructure services. Thanks to the modeling and simulation, it could visualize that the proposed solution is efficient. It improves the level of service from the intersections to E on Calle 33 with Calle 34 and a service level B to the other intersection on the Carrera 29. Service level B corresponds to a stable flow range. On the other hand, the level of service E corresponds to a level of operation close to the limit of the capacity. Therefore, this is considered a viable alternative.
Conclusion
The mobility in Villavicencio is one of the main concerns in Colombia considering that it is a central point for the transit of merchants from the east to the capital. Therefore, inside the mobility studies, the traffic flow analysis is crucial to determine aspects that generate knowledge about the source of congestion.
This article exhibits a mobility study in the city’s center, particularly in the avenue Alfonso Lopez and its two intersections Carrera 33 with Carrera 29 and Carrera 33 with Calle 34. Variables as travel time, speed, volume of vehicles, traffic light times, and level of service were estimated from data collected through fieldwork.
The vehicle’s speed at the avenue Alfonso Lopez was analyzed considering the two paths and using the plate method in the valley and peak moments over four days. The results show that the speed for both paths in the valley moments is lower than the peak moments. The findings were expected because more vehicles are circulating with people returning from or to their homes at the peak time.
Likewise, there are particular sections in both paths with lower velocities concerning the others due to the proximity to educational institutes, where a crowd of people is presented using public or other kinds of transport. The closeness to an intersection generates congestion as well. Furthermore, there are particular sections with higher velocities than the others, for example, not many people use public transport in this place. As far as the mean of transport is concerned, public transport has a lower velocity. It is expected to pick up passengers and multiples stops. On the other hand, taxis have higher speeds. We associated it with the impatient attitude of the taxi drivers and their expertise.
At the intersections under this study, the vehicular volume, traffic lights times data from the fieldwork, and the level of service analysis at each intersection permitted to obtain the inputs required to simulate possible solutions for improving the mobility at the places. The results show that the proposal related to implementing the new lanes increases the road capacity and the level of service that leads to travel time reduction and, therefore, better convenience for the users’ road.
The proposal for continuing the traffic flow studies to improve mobility is sensors support to reduce cost and time. However, considering the usual funding limitations for research projects, an alternative could be including cameras and algorithms for object detection to obtain data, as in this study.
Acknowledgments
Thanks to Corporación Universitaria del Meta for supporting the development of this Project. Many thanks to the researchers Francisco Munévar, Joe Martinez, Paola Andrea Velásquez Parrado, Juan Camilo Cubidez Ordoñez, Jefferson Clavijo Morales, who carried out the data collection and the two graduates Ruby Lorena Alvarez Vanegas and Camila Andrea Carvajal Pardo, who performed the modeling for their support and considerable efforts in the field work. Also, thanks to the Universidad Antonio Nariño and Universidad ECCI for supporting researchers in the preparation and dissemination of these results. Finally, many thanks to RUMBO network of which the researchers of this project are part.
Authors’ Information
Carlos Diaz is architect at the Universidad Catolica de Colombia and master in cultural and territory heritage at the Universidad Javeriana, Colombia. He is professor at the Corporacion Universitaria del Meta, Colombia
Karen Beltran is civil engineer at the Corporacion Universitaria del Meta, Colombia and master student in engineering at the Universidad Nacional de Colombia.
Cesar Diaz is electric engineer at the Universidad de los Andes, Colombia, master in electronics engineering at the Universidad Javeriana, Colombia, and Ph.D. in computer science at the University of Luxembourg. He is professor at the Universidad ECCI, Colombia.
Alejandra Baena obtained her B.Sc. in physics at the Universidad Nacional de Colombia, holds a master degree in forensic sciences at the Universidad Autonoma de Madrid, and a Ph.D. in physics at the Universidad Complutense de Madrid. She is professor at the Universidad Antonio Nariño, Colombia.
Authors’ Contributions
Carlos Diaz participated leading the fieldwork, co-directing the thesis related to this project, and preparing the manuscript.
Karen Beltran participated in the manuscript preparation.
Cesar Diaz participated in the results analysis and divulgation as well as in the manuscript preparation.
Alejandra Baena participated in the results analysis and divulgation as well as in the manuscript preparation.
Competing Interests
The authors declare that they have no competing interests.
Funding
No funding was received for this project.