Introduction
The recent outbreak of the coronavirus (COVID-19) is an unprecedented situation worldwide. The World Health Organization (WHO) and public health authorities around the world are taking steps to slow the outbreak of COVID-19 and reduce infection rates. While many companies are developing and implementing business continuity plans, all employers need to prepare, get along and respond appropriately as the COVID-19 pandemic evolves [1]. The COVID-19 spreads not only through respiratory droplets or contact with contaminated surfaces, but through [2], viz airborne particles and fomites.
The risk of exposure to COVID-19 in the workplace depends on the likelihood of reaching one meter from other people, frequent physical contact with people who may be infected with COVID-19 and contact with contaminated surfaces and objects [3]. The WHO identified three levels of exposure risk in workplace [4], viz:
Low exposure risk - Jobs or work without frequent, close contact with the general public or others. Workers in this group have minimal occupational contact with the public and other co-workers. Examples of such chores may include remote workers (i.e. working from home), office workers without frequent close contact with others and workers providing teleservices.
Medium exposure risk - Activities or assignments with close, frequent contact with the general public or others. This risk level may apply to workers who have frequent and close contact with the people in high-population-density work environments (e.g. food markets, bus stations, public transport, and other work activities where physical distancing of at least one meter may be difficult to observe), or tasks that require close and frequent contact between co-workers. This may also include frequent contact with people returning from areas with community transmission. Examples of such duties may include front-line workers in retail, home deliveries, accommodation, construction, police and security, public transport, and water and sanitation. Workplaces for medium-risk jobs require daily cleaning and disinfection at least twice a day of objects and surfaces that are touched regularly, including all shared rooms, surfaces, floors, bathrooms and changing rooms [5].
High exposure risk - Jobs or tasks with close contact with people who may be more likely to have COVID-19, as well as contact with objects and surfaces possibly contaminated with the virus. Examples include transporting people known or suspected to have COVID-19 without separation between the driver and the passenger, providing domestic services or home care for people with COVID-19, and having contact with the deceased who were known or suspected of having COVID-19 at the time of their death. Employments that may fall under this category include domestic workers, social care workers, personal transport and home delivery providers and repair technicians (e.g., plumbers, electricians) who have to provide services in the homes of people with COVID-19. High-risk workplaces require specific measures since the possibility of suspending activity must be assessed. Requires cleaning and disinfection before and after contact with any known or suspected case of COVID-19, use of a medical mask, disposable lab coat, gloves and eye protection for workers who come into contact with suspected or known people with COVID-19 [5].
Aside from the above, there may be jobs in the same work environment with different levels of risk and different jobs or work items may have similar exposure levels. Thus, managers must carry out risk assessments to determine the possibility of exposure risk, to implement preventive measures [4]. The risk assessment must be carried out for each specific work environment and to each allocation. Following this line of thinking, for each risk assessment it is prudent to consider the environment, the task, the threat, if any (e.g., for front-line personnel) and available resources, such as personal protective equipment. Furthermore, the specificities of each worker should be considered since some workers may be at a higher risk of developing serious COVID-19 disease due to age or pre-existing medical conditions [5]. However, the implementation of the action plan and the preventive measures is not sufficient. All new processes and working measures must be understood and accepted by each one to guarantee the commitment of the entire team [6]. However, assessing employee satisfaction is a difficult task that comprises a variety of issues that depend on both the employee and the organization [7], [8]. The present work aims to assess the satisfaction of the employees of water analysis laboratories (sector classified by WHO as to have a medium risk of exposure to the virus [4]) with the preventive measures resulting from the pandemic crisis.
Related Work
In the literature, employee satisfaction studies are common, but there are still not many studies related to employee satisfaction in times of a pandemic because it is a recent topic. Using the ScienceDirect platform the search for the term COVID-19 gave 30.698 results. However, combining the terms COVID-19, risks and employee satisfaction only 256 results were obtained. Studies related to COVID-19 and employee satisfaction in the areas of health [9], [10] and in the hospitality sector [11]–[13] are the most frequent.
Health Risks
Tengilimoglu et al. studied the levels of anxiety, depression, and stress of health employees during the COVID-19 pandemic in Turkey. The authors stated that the biggest cause of anxiety or stress among health professionals comes from the fear of contaminating their family members with the COVID-19 virus [9]. Zhang et al. predicted the anxiety and satisfaction of health professionals during the COVID-19 pandemic based on a cohort composed by 712 healthcare workers [10]. Grounded on an 8-point framework the authors present an empirical measure of COVID-19 Organizational Support and investigate its associations with healthcare workers’ anxiety and life satisfaction. According to the authors the proposed measure enables healthcare institutions to assess, monitor, compare and improve COVID-19 specific support and contribute to minimize the anxiety levels of the collaborators during the pandemic [10].
Hospitality Industry
With regard to the hospitality industry, Bajrami et al. examined various effects of COVID-19 (e.g., job insecurity, complaints from employees during isolation, risk behavior in the workplace and changes in the organization) on work motivation, job satisfaction and sales intentions [11]. The study was carried out on Serbia and embraced a cohort of 624 hospitality workers. The authors point out that the job insecurity and changes in the organization showed a negative impact in all outcomes, whereas while risk-taking behavior has a negative influence only in job satisfaction. Regarding demographic variables only the age and marital status influence job motivation and turnover intentions [11]. Farmaki and Stergiou explored front-line hotel employees’ views about working during the COVID-19 pandemic to identify the factors that may influence their ability and willingness to report to work. Despite the difficulties in the distinction between barriers to ability or willingness to report to work the authors proposed some remedial recommendations such as training, measures to facilitate employees’ transport, measures for infection controls in customer areas, and the reinforce the communication between the organization and the employees [12]. Jung et al. examined the effects of job insecurity caused by COVID-19 on job engagement and turnover intent based on a cohort comprising 314 employees of Seoul five-star hotels. According the authors the perceptions of job insecurity had negative effects on the engagement of deluxe hotel employees and led to the increased of turnover intent [13]. The study also reveals that the job insecurity had a greater influence on employees’ engagement; e.g., if one state that Generation Y than Generation X, one is asserting that the impact of job insecurity is higher for people of generation Y than for people of generation X [13]. Kang and Shin examined how risk reduction strategies using technology innovation for social distancing and cleanliness (e.g., kiosk check-in system, mobile check-in system, robot cleaning system, and ultraviolet light cleaning system) at hotels influence customer health risk perception and decision-making behaviors in both pandemic and post-pandemic scenarios. The study allowed to identify that the perceived health risk mediates the relationship between expected interaction and hotel booking intention. The authors highlighted that low levels of expected interaction through technology mediated systems lead to low levels of perceived health risk [14].
Fundamentals
Logic Programming
There are many approaches to Knowledge Representation and Reasoning (KRR) using the epitome of Logic Programming (LP), namely in the areas of Model Theory and Proof Theory. In this article, the Proof Theoretical methodology for problem solving was adopted and expressed as an extension of the LP language [15]. Under this setting a LP will be grounded on a finite set of clauses as presented in Listing [1].
The Prime Example of a Logic Program

The first clause denotes predicate’s closure, "," designates "logical and", while "?" is a domain atom denoting "falsity", the \(p_{i}\), \(q_{j}\), and \(p\) are classical ground literals, i.e., either positive atoms or atoms preceded by the classical negation sign \(\rightharpoondown\) [15]. Indeed, \(\rightharpoondown\) stands for strong negation, i.e., a strong declaration that speaks for itself, while not denotes negation-by-failure, i.e., a failure in proving a certain statement since it was not declared in an explicit way. According to this way of thinking, a set of exceptions (or abducibles) are present in every program, given here in the form of exemptions to the extensions of the predicates that make the program, i.e., clauses of the form
\(exception_{p_{1}}\), .. , \(exception_{p_{j}}\)(\(0\geq j\geq k\)), \(k\in\mathbb{Z}\)
that denote data, information or knowledge that cannot be ruled out [16]. On the other hand, clauses of the type
\(?\)(\(p_{1}\), .. , \(p_{n}\), \(not\) \(q_{1}\), .., \(not\) \(q_{n}\))\(n,m\geq 0\)
are Integrity Constraints (ICs) (or invariants) that make it possible to specify the context under which the universe of discourse should be understood [15], [17].
It is undeniable that expressing theories as logic programs has become more natural and general as the field of LP matured and other fields began to use its tools and results. Theories are typically uttered as a series of patterns (rules) and facts that make it possible to infer non-logical consequences using logical inference. In writing such rules and facts, both explicit (or strong) negation and explicit declarations may be used to reinforce knowledge. Theories, on the other hand, can be further refined by adding special rules in the form of ICs. These assume that, regardless of the assumptions, some conditions must be met. An implicit constraint on any sound theory has overall consistency, i.e., it must not be possible to infer a conclusion and its contradiction. Since the most common situation in the real world is incomplete and updateable information, any system that makes serious attempts to deal with real-world situations must cope with such complexities. The principle used is the Open World Assumption (OWA) where everything is unknown or undefined until one has some secure evidence of its truthfulness or falseness. Indeed, this principle differs from the more usual Closed World Assumption (CWA) where everything is assumed false until there is solid evidence of its truthfulness. It was not taken a fuzzy logic approach once thresholds would be needed. For such attitude an a priori evaluation of falseness or truthfulness would be required.
A Thermodynamics Approach to Knowledge Representation and Reasoning
Energy transfer operations or processes are systematically analyzed to determine how they can be assessed. It turns out that energy transfer should not only be characterized by the act or process itself but should also be seen in a broader context. This context is introduced as the entropic potential of the transferred energy. It takes into account the entire energy transfer in its initial and finite states, i.e., it starts, for example, as pure exergy if it is a primary energy, and ends as pure anergy if it has become part of the internal energy of the environment. With this in mind, an energy degradation process can be defined under a proper tangible background. Indeed, the problem-solving methodology presented and discussed in this article is based on this perception and aims to describe the practices of KRR as a process of energy degradation [17]–[19]. In order to explain the basic rules of the proposed approach, the First and Second Law of Thermodynamics are considered, attending that one’s system moves from state to state over time. The first part, also known as the Energy Saving Law, states that the total energy of an isolated system is constant, i.e., cannot change over time. This means that energy can be converted but cannot be generated or destroyed. The second part deals with Entropy, a property that quantifies the orderly state of a system and its evolution. These characteristics fit the proposed vision of KRR practices, and have to be understood as a process of energy degradation or, in other words, when one looks to system entropic state, its energy can be break up and used in sense of erosion, but never used in the sense of destruction, viz:
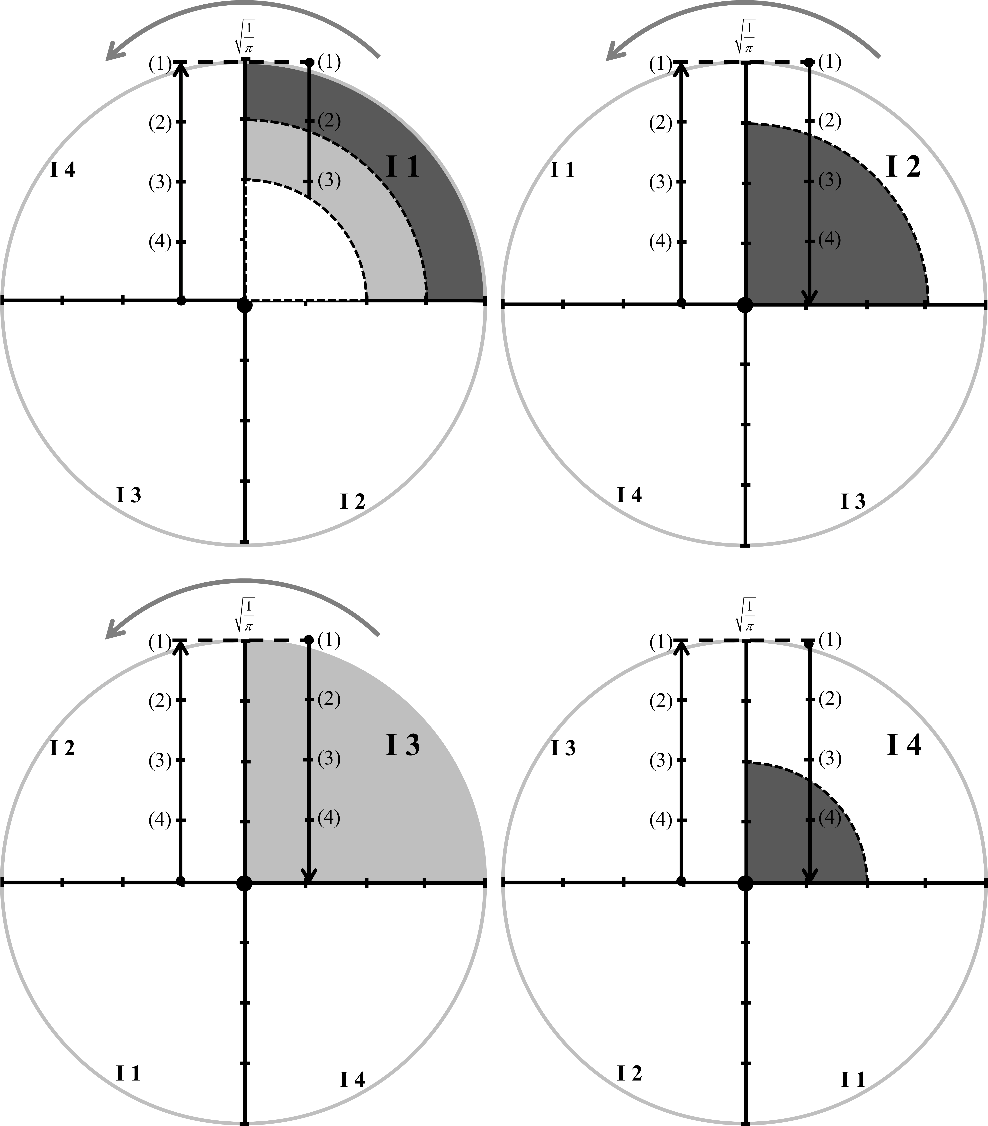
Exergy, sometimes called available energy or more precisely available work, is the part of the energy which can be arbitrarily used after a transfer operation or, in other words, the entropic state of the universe of discourse. In Figure 2 it is given by the dark colored areas.
Vagueness, i.e., the corresponding energy values that may or may not have been transferred and consumed. In Figure 2 are given by the gray colored areas.
Anergy, that stands for an energetic potential that was not yet transferred and consumed, being therefore available, i.e., all of energy that is not exergy.
These terms refer to all possible processes as pure energy transfer and consumption practices [17]–[19].
Artificial Neural Networks
Artificial Neural Networks (ANNs) are computing tools inspired by studies of the human brain and nervous system. In fact, they are mathematical models that simulate such systems as are understood today. One of the main characteristics of ANNs is their ability to learn. In fact, it is important to note that ANNs are not traditional computer programs. They learn from examples through a process called training, in which ANNs organize themselves to adjust an internal set of parameters (i.e. synapses weights) that are used to collect the information contained in the data. Compared to traditional methods, ANNs treat inaccurate and/or incomplete data, give approximate results, and are less prone to outliers. In addition, it is not necessary to accept restrictions or to know the relationships between variables from the outset. Multi-Layer Perceptron (MLP) is one of the most widespread ANN architectures in which neurons are layered and only forward connections exist [20]. The MLP design is typically trial and error using an upward approach, starting with an initial architecture that is adjusted to minimize the internal error (e.g., Mean Square Error) [20], [21].
Material and Methods
Employees
The study was carried out in a water laboratory in southern Portugal. The age of the employees varied between 18 and 60 years (mean age 38 ± 20 years), with 61% women and 39% men. A questionnaire to assess employee satisfaction with the new pandemic crisis procedures was created and used for a cohort of 64 elements. The questionnaire was used over a period of five months (June to October) and resulted in a database of 320 records. In order to avoid possible hidden errors in connection with sampling procedures, the questionnaires were applied to all employees of the laboratories [22].
Questionnaire
The questionnaire was divided into two segments; the former one contained frequently asked questions (e.g. age, gender, educational qualification, seniority and department within the organization), while the latter contained points for assessing employee satisfaction with the current protective measures.
In the first part of the questionnaire the answers are descriptive, while in the others the Likert scale was used with four levels, i.e., Very Dissatisfied, Slightly Dissatisfied, Satisfied and Very Satisfied. In addition, the participants are requested to specify the tendency of his/her answer, i.e., growing tendency (Very Dissatisfied \(\rightarrow\) Very Satisfied) or the opposite (Very Satisfied \(\rightarrow\) Very Dissatisfied).
Methodology
The Action Research Methodology for problem solving, which is also known as Participatory Action Research, community-based study, co-operative enquiry, action science and action learning - is an approach commonly used for improving conditions and practices in a range of environments and will be used in this work. It involves people conducting systematic enquiries in order to help them improve their own practices, which in turn can enhance their working environment and the working environments of those who are part of it. The purpose of undertaking action research is to bring about change in specific contexts. Action research’s strength lies in its focus on generating solutions to practical problems and its ability to empower people, by getting them to engage with research and the subsequent development or implementation activities.
Results and Discussion
Sample Characterization
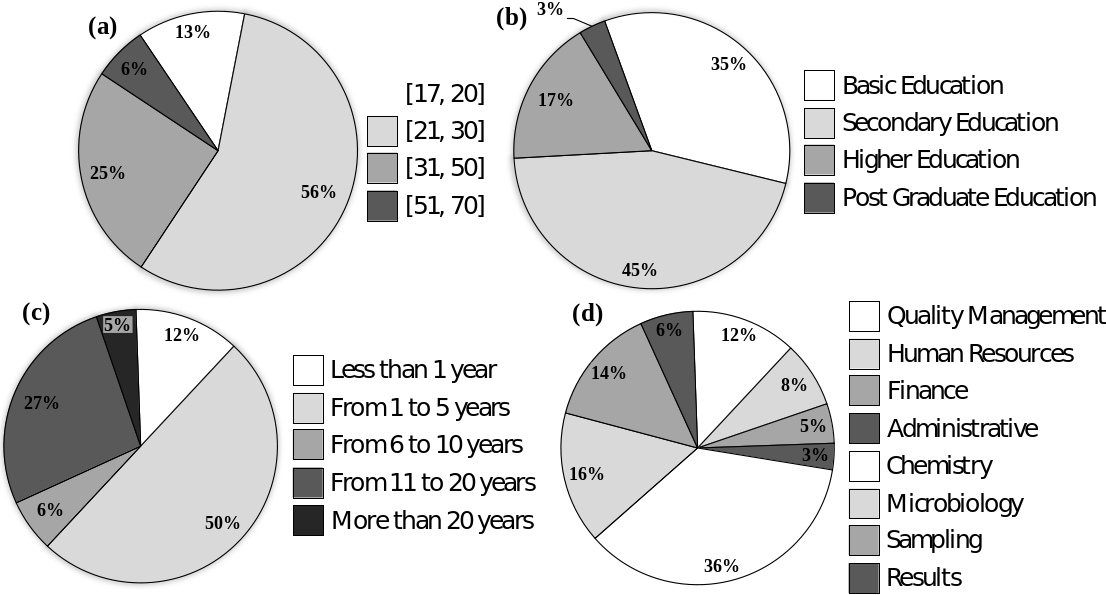
The gathered data was classified by age-groups as shown in Figure 1(a) (i.e., 17-20, 21-30, 31-50 and 51-70 years old). 69% of the partakers are younger than 30 years of age while 6% are older than 51 years of age. In terms of academic qualifications, 80% of the cohort reported having basic or secondary education, 17% reported having a degree and 3% reported having postgraduate education (Figure 1(b)). In terms of length of service, 50% of participants reported 1-5 years, 32% more than 11 years, and 12% less than 1 year (Figure 1(c)). In terms of departmental areas (Figure 1(d)), 34% belong to the management sector (consisting of Quality Management, Human Resources, Finance and Results departments), and 66% belong to the technical sector (i.e. chemistry, microbiology and sampling departments)).
A Thermodynamic Approach to Data Attainment and Processing
Aiming to collect information about employees’ satisfaction concerning the new procedures related with the pandemic crisis, the second part of the questionnaire comprises questions related with the employees’ opinions about Organization Related Items - Four Items (ORI - 4), Training Related Items - Four Items (TRI - 4), Resources Related Items - Four Items (RRI - 4), and Cleaning and Disinfection Related Items - Five Items (CDRI - 5). Since the participants were requested to mark the alternative(s) that best reflect their feelings concerning each item and the tendency of his/her answer, i.e., growing tendency (Very Dissatisfied \(\rightarrow\) Very Satisfied) or the opposite (Very Satisfied \(\rightarrow\) Very Dissatisfied), the answer options were given in terms of an expanded version of a Likert scale, viz Very Satisfied (4), Satisfied (3), Dissatisfied (2), Very Dissatisfied (1), Dissatisfied (2), Satisfied (3), Very Satisfied (4).
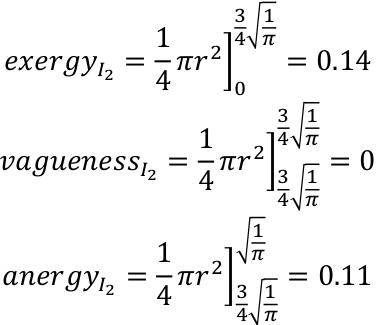
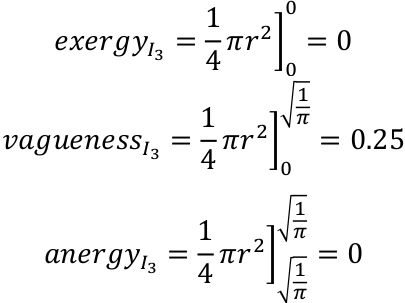
In order to quantify the qualitative information and make the process intelligible, complete calculation details for Organization Related Items - Four Items (ORI - 4) are provided. Table 1 shows the results regarding an employee answers to the ORI - 4. For example, the answer to I1 was Dissatisfied (2) \(\rightarrow\) Satisfied (3), shows a trend in the employee’s opinion with a decrease in entropy, i.e., there is an increase trend in his/her opinion. For I2 and I4 the answers were Dissatisfied (2) and Satisfied (3), respectively, a fact that speaks for itself, while for I3 no options were pointed out, which indicates a vague situation, i.e., the value of the energy consumed is unknown, although it is known that it is in the bandwidth is the interval \(0...1\).
| Items | Scale | |||||||
| (4) | (3) | (2) | (1) | (2) | (3) | (4) | vagueness | |
| I1 | × | × | ||||||
| I2 | × | |||||||
| I3 | × | |||||||
| I4 | × | |||||||
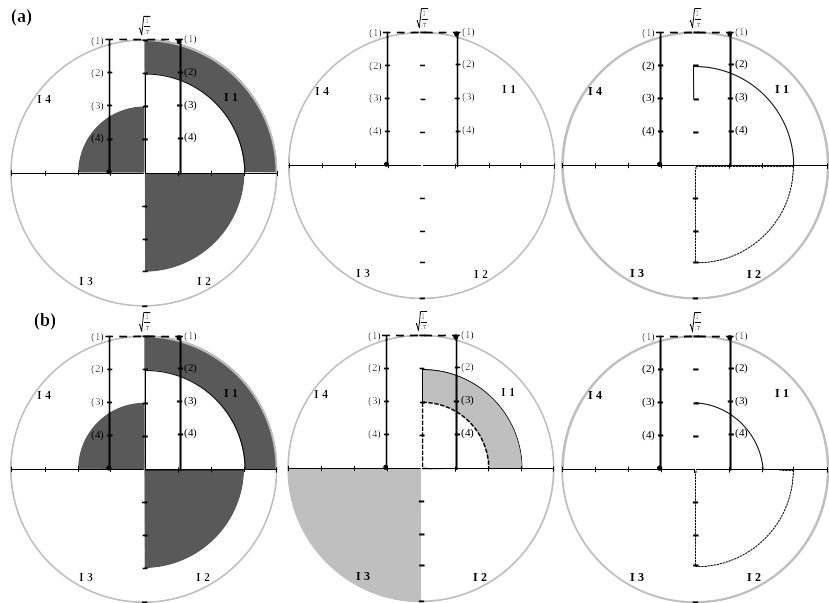
Figure 2 and Figure 3 describe such responses regarding the different forms of energy, i.e., exergy, vagueness and anergy. Bearing in mind the fact that the markings on the axis correspond to one of the possible scaling options, the employees’ opinion behaves better when the entropy decreases, which is the case with I1, as shown in Table 2 for the Best and Worst Case Scenarios (BCS/WCS).
| Items | Best-case scenario (BCS) | Worst-case scenario (WCS) |
|---|---|---|
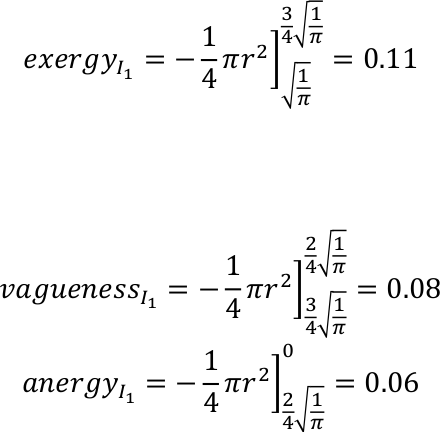
| I1 | 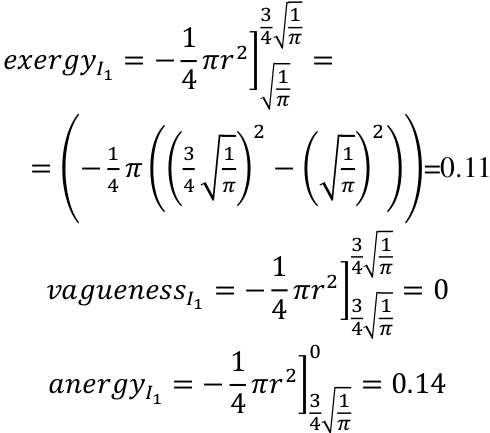 |
 |
| I2 | 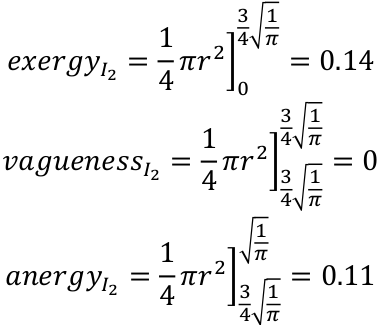 |
 |
| I3 | 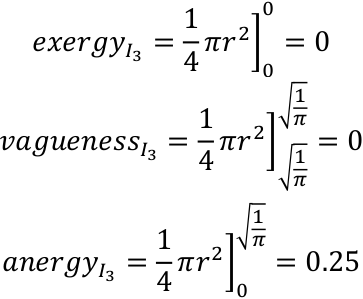 |
 |
| I4 | 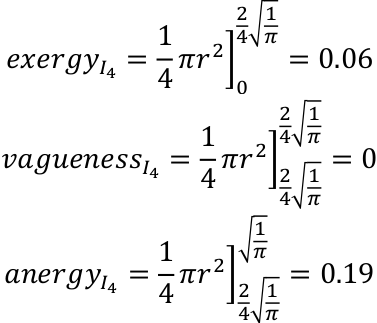 |
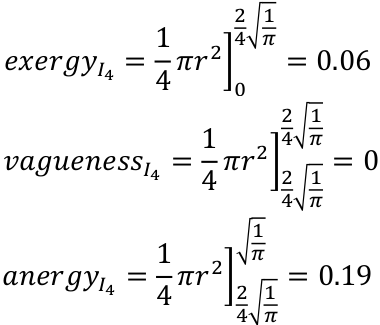 |
The formula used in Table 2 report the way to handle sub-sections of a circle area, they are self-explanatory. On the other hand, the data collected above may now be structured in terms of the predicate organization related items (ori - 4) in the form
\(ori - 4:EXergy,VAgueness,ANergy,Employee\) \(Satisfaction\) \(Assessment,\)
\(Quality-of-Information \rightarrow True, False\)
whose extent follows (Table 3 and Listings [2] and [3]).
| Items | Ex BCS | VA BCS | AN BCS | ESA BCS | QoI BCS | EX WCS | VA WCS | AN WCS | ESA WCS | QoI WCS |
|---|---|---|---|---|---|---|---|---|---|---|
| ORI - 4 | 0.31 | 0 | 0.69 | 0.95 | 0.69 | 0.31 | 0.33 | 0.36 | 0.77 | 0.36 |
The extent of the predicate ori - 4 for the Best-case scenario

The extent of the predicate ori - 4 for the Worst-case scenario

The evaluation of Employees Satisfaction Assessment (ESA) and Quality of Information (QoI) for the different items that make the ori - 4 are now given in the form, viz:
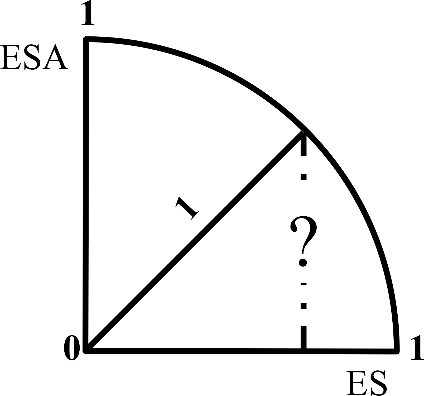
ESA is figured out using \(ESA=\sqrt{1-ES^{2}}\) (see Figure 4), where \(ES\) stands for the exergy’s that may have been consumed, a value that ranges in the interval \(0 ... 1\). In the Best-case scenario, \(ES=exergy\), while in the Worst-case scenario, \(ES=exergy+vagueness\).
\(ESA_{BCS}=\sqrt{1-(0.31)^{2}}=0.95\)
\(ESA_{WCS}=\sqrt{1-(0.31+0.33)^{2}}=0.77\)
QoI is evaluated in the form, viz.
\(QoI=1-ES/Interval\) \(length(=1)\)
\(QoI_{BCS}=1-0.31=0.69\)
\(QoI_{WCS}=1-(0.31+0.33)=0.36\)
To complement Table 1, Table 4 and Table 5 shows an employee answers to TRI - 4, RRI - 4, and CDRI - 5.
| Items | Scale | ||||||||
| (4) | (3) | (2) | (1) | (2) | (3) | (4) | vagueness | ||
| TRI - 4 | S5 | × | × | ||||||
| S6 | × | ||||||||
| S7 | × | ||||||||
| S8 | × | ||||||||
| RRI - 4 | S9 | × | |||||||
| S10 | × | × | |||||||
| S11 | × | ||||||||
| S12 | × | ||||||||
| CDRI - 5 | S13 | × | |||||||
| S14 | × | ||||||||
| S15 | × | ||||||||
| S16 | × | ||||||||
| S17 | × | ||||||||
| Items | Ex BCS | VA BCS | AN BCS | ESA BCS | QoI BCS | EX WCS | VA WCS | AN WCS | ESA WCS | QoI WCS |
|---|---|---|---|---|---|---|---|---|---|---|
| ORI - 4 | 0.31 | 0 | 0.69 | 0.95 | 0.69 | 0.31 | 0.33 | 0.36 | 0.77 | 0.36 |
| TRI - 4 | 0.53 | 0 | 0.47 | 0.85 | 0.47 | 0.53 | 0.36 | 0.11 | 0.46 | 0.11 |
| RRI - 4 | 0.34 | 0 | 0.66 | 0.94 | 0.66 | 0.34 | 0.36 | 0.3 | 0.71 | 0.3 |
| CDRI - 5 | 0.41 | 0 | 0.59 | 0.91 | 0.59 | 0.41 | 0 | 0.59 | 0.91 | 0.59 |
| Global | 0.40 | 0 | 0.6 | 0.91 | 0.6 | 0.4 | 0.26 | 0.34 | 0.71 | 0.34 |
In Table 5, the row Global corresponds to the average of the Item (e.g., In the column Ex BCS, \(0.40 = (0.31 + 0.53 + 0.34 + 0.41)/4\)).
The ESA Implementation - A Logic Programming Line
The Formal Framework
Logic Programming (LP) is a programming paradigm which is largely based on Pure Logic. Any program written in a logic programming language is a set of sentences in logical form, expressing facts and rules about some problem domain, i.e., a problem-solving methodology that involve expressing problems and their solutions in a way that a computer can execute using logic inference. Indeed, LP is a creative process that uses deductive methods for problem solving based on the presumption that an attempt is made to construct evidence for the presumption. In this subsection a mathematical logical program is presented that considers the perception of the employee with respect to a particular subject (individual opinions about the satisfaction with the safety procedures) in order to evaluated the organization as a whole (Programs 4 and 5). This framework provides the basis for a symbolic assessment of the level of employees’ satisfaction of an organization, plus a measure of its sustainability (QoI), i.e., a set of truth values that range in the interval 0 ... 1 [17], [23].
The Best-Case Scenario
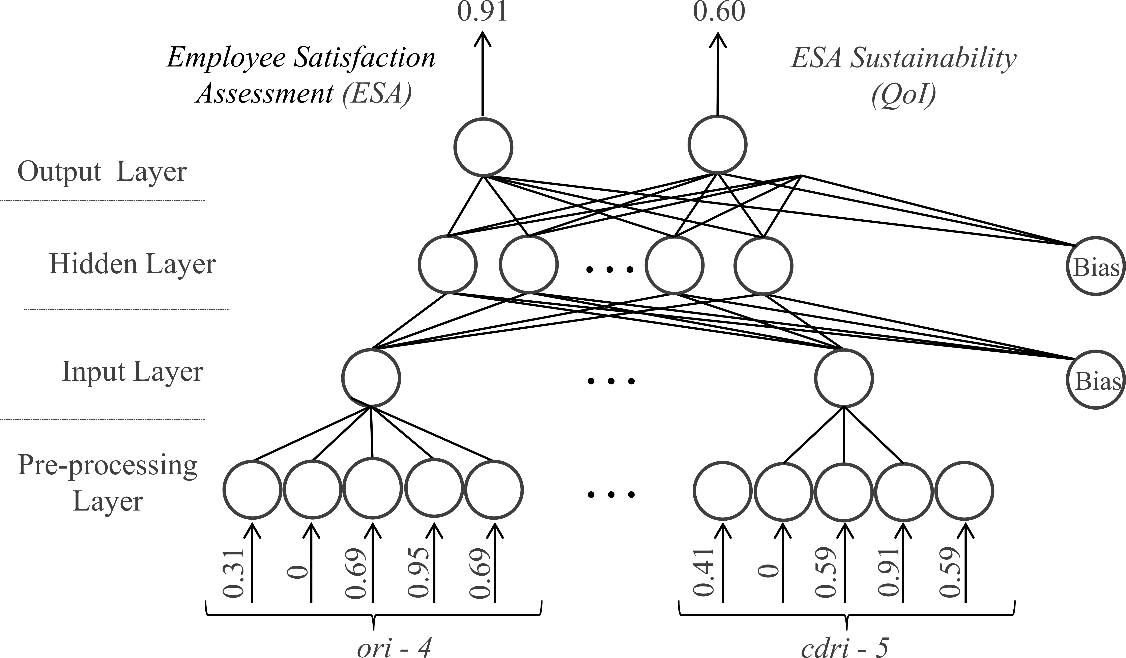
Regarding the Best-case scenario one may have the program presented in Listing [4]. The extensions of predicates ori-4, tri-4, rri-4, and cdri-5 are now put together. It is now possible to generate the data sets that will allow one to train an ANN for the Best-case Scenario (see Figure 5) [17], [23], viz.
The input in the form of the employees’ opinions about Organization Related Items - Four Items (extent of predicate ori-4), Training Related Items - Four Items (extent of predicate tri-4), Resources Related Items - Four Items (extent of predicate rri-4), and Cleaning and Disinfection Related Items - Five Items (extent of predicate cdri-5).
The output in terms of an evaluation of the Employee Satisfaction Assessment (ESA) of an institution and its sustainability (QoI), truth values that range in the interval 0 ... 1.
The make-up of the LP that establishes the ESA implementation in the Best-case scenario

In present work a cohort of 64 employees was enrolled, and the training/testing sets was gotten by clarifying the theorem presented in Equation [1] in every possible way, i.e., all the different possible sequences that combine the terms or clauses of the predicates’ extent ori-4, tri-4, rri-4, and cdri-5, a number given by the expression \(C_{1}^{Predicates-extent} + ... + C_{Predicates-extent}^{Predicates-extent}\), where \(C_{Predicates-extent}^{Predicates-extent}\) is a predicates-combination subset, with predicates-extent elements presented in Equation [2].
\[ \begin{split} \forall (EX_{1}, VA_{1}, AN_{1}, ESA_{1}, QoI_{1}, ... , EX_{4}, VA_{4}, AN_{4}, ESA_{4}, QoI_{4}) \\ (ori-4(EX_{1}, VA_{1}, AN_{1}, ESA_{1}, QoI_{1}), \\ tri-4(EX_{2}, VA_{2}, AN_{2}, ESA_{2}, QoI_{2}), \\ rri-4(EX_{3}, VA_{3}, AN_{3}, ESA_{3}, QoI_{3}), \\ cdri-5(EX_{4}, VA_{4}, AN_{4}, ESA_{4}, QoI_{4})) \end{split}\]
\[ \begin{split} \{\{ori-4(EX_{1}, VA_{1}, AN_{1}, ESA_{1}, QoI_{1}), \\ tri-4(EX_{2}, VA_{2}, AN_{2}, ESA_{2}, QoI_{2}), \\ rri-4(EX_{3}, VA_{3}, AN_{3}, ESA_{3}, QoI_{3}), \\ cdri-5(EX_{4}, VA_{4}, AN_{4}, ESA_{4}, QoI_{4})\}, ... \} \approx \\ \approx \{\{ori-4(0.31, 0, 0.69, 0.95, 0.69), tri-4(0.53, 0, 0.47, 0.85, 0.47), \\ rri-4(0.34, 0, 0.66, 0.94, 0.66), cdri-5 (0.41, 0, 0.59, 0.91, 0.59)\}, ... \} \end{split}\]
With regard to the output of the ANN, i.e., both the Employee Satisfaction Assessment (ESA) and a measure of its Sustainability (QoI), for the Best-case scenario they may be weighed in the mold by Equation [3] leading to the ANN depicted in Figure 5.
\[\label{equ:output} \begin{split} \{\{(ESA_{ori-4}+ESA_{tri-4}+ESA_{rri-4}+ESA_{cdri-4}/4\}, ... \}_{BCS} \approx \\ \approx \{\{(0.95 + 0.85 + 0.94 + 0.91)/4 = 0.91\}, ... \}_{BCS} \\ \{\{(QoI_{ori-4}+QoI_{tri-4}+QoI_{rri-4}+QoI_{cdri-4}/4\}, ... \}_{BCS} \approx \\ \approx \{\{(0.69 + 0.47 + 0.66 + 0.59)/4 = 0.60\}, ... \}_{BCS} \end{split}\]
It is therefore possible to describe an employee’s answers to the various items presented in the questionnaire in terms of the entropy they are associated with over a period of 5 (five) months (see Figure 6). Entropy follows a decreasing line from the first to the third month, which means that the employee increases his/her satisfaction with the safety procedures during this time. However, by the end of this month, it had inflected, i.e., the employee satisfaction with the preventive measures resulting from the pandemic crisis is declining. A view that culminates with a full break at the end of the 5th month.
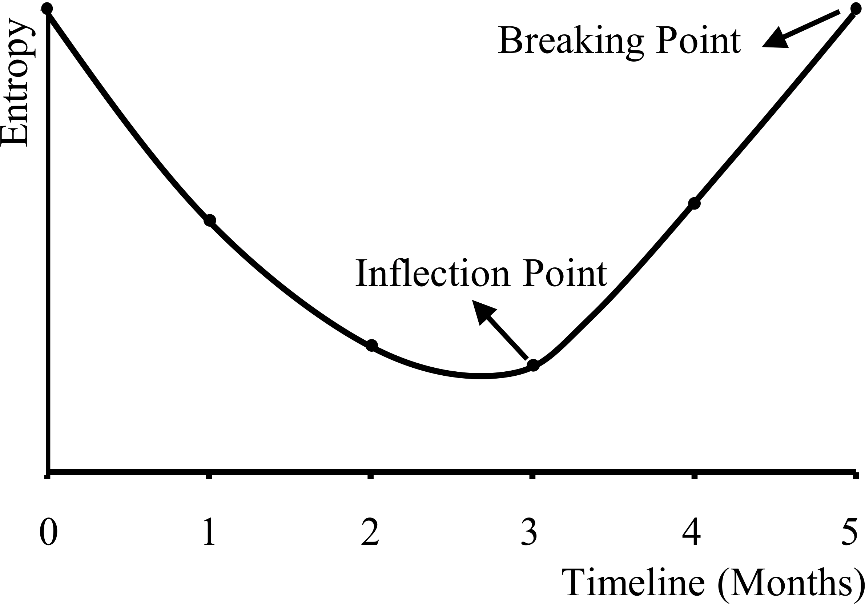
This process makes it possible to monitor and manage the evolution of the system; to be pro-active through simulation, i.e., to foretell on the basis of observation, experience, or scientific reason; to act on the matters affecting its behavior, i.e., consider the answers to the items that contribute more to the deterioration of the system (i.e., have a higher entropic value or a higher value of exergy consumption).
The Worst-Case Scenario
Regarding the Worst-case scenario, ESA and QoI are evaluated in a similar way by the program presented in Listing [5]
The make-up of the LP that establishes the ESA implementation in the Worst-case scenario

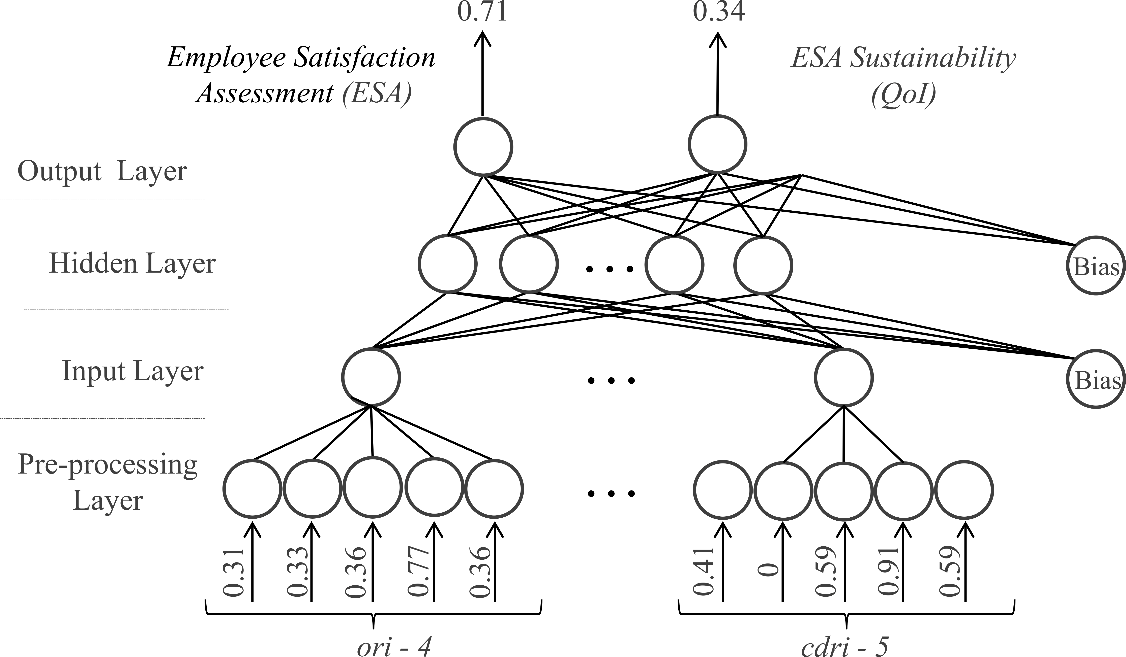
In this case, regarding the output of the ANN, i.e., both the ESA and the QoI may be weighed as before as presented in Equation [4] leading to the ANN depicted in Figure 7.
\[\label{equ:output2} \begin{split} \{\{(ESA_{ori-4}+ESA_{tri-4}+ESA_{rri-4}+ESA_{cdri-4}/4\}, ... \}_{WCS} \approx \\ \approx \{\{(0.77 + 0.46 + 0.71 + 0.91)/4 = 0.71\}, ... \}_{WCS} \\ \{\{(QoI_{ori-4}+QoI_{tri-4}+QoI_{rri-4}+QoI_{cdri-4}/4\}, ... \}_{WCS} \approx \\ \approx \{\{(0.36 + 0.11 + 0.30 + 0.59)/4 = 0.34\}, ... \}_{WCS} \end{split}\]
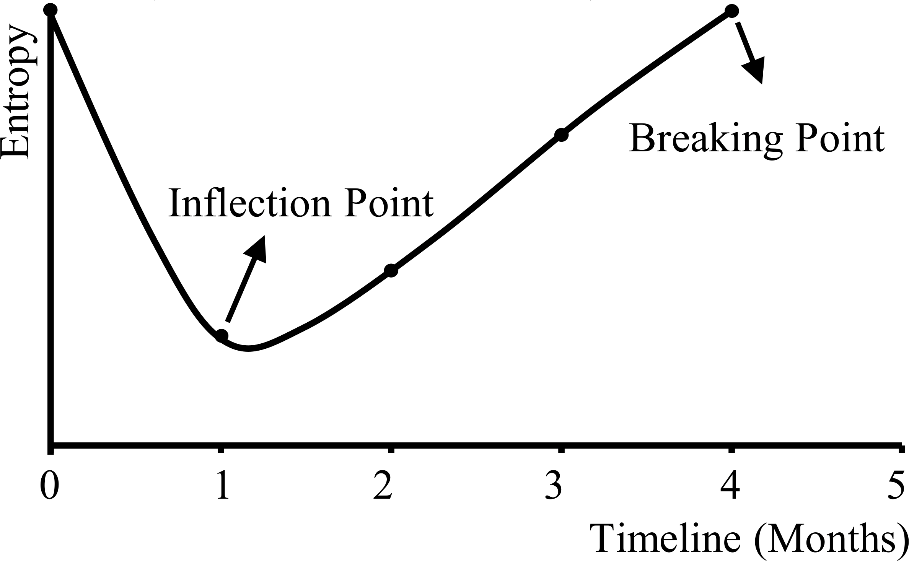
Regarding the entropy associated over a period of 5 (five) months the same comments apply in this scenario, but the inflection and break points occur earlier (see Figure 8).
The software used to implement ANNs was the Waikato Environment for Knowledge Analysis (WEKA), while maintaining the standard software parameters [23], [24]. To guarantee the significance of the results attained, 25 experiments were performed in all tests. In each simulation, the database was randomly split into two mutually exclusive partitions, i.e., the training set, with 2/3 of the data, used to build-up the model, and the test set, with the remaining cases to evaluate its performance. Table 6 presents the confusion matrix for the ANN model. The values shown in Table 6 allow computing the model accuracy for training set (92.1%, i.e., 198 well classified in 215) and for test set (90.5%, i.e., 95 well classified in 105). In the classification process, high denotes ESA higher than 0.85, medium stands for ESA ranging in the interval 0.5…0.85, and low were assigned to ESA lesser than 0.5.
| Target | Predictive | ||||||
|---|---|---|---|---|---|---|---|
| Training set | Test set | ||||||
| Low | Medium | High | Low | Medium | High | ||
| Low | 41 | 1 | 0 | 16 | 0 | 0 | |
| Medium | 2 | 119 | 1 | 5 | 67 | 2 | |
| High | 0 | 3 | 38 | 3 | 12 | ||
ANNs stand for computational tools that can be used in generalization processes, i.e., have a correct input-output mapping even if the inputs are different from the examples used to train the network. However, if the network over stamps the training data, it may capture some aspects that are present in the training data that are not applicable to the function being modeled. This phenomenon is known as overfitting and occurs when the network loses the ability to generalize [20]. However, considering that the accuracies of training and test sets are close, the selected network performed well in prediction of the output variables for an independent data set and, therefore, show no overfitting.
Conclusions and Future Work
Employee satisfaction is an old but at the same time very topical issue, as it is closely related to productivity. The actual pandemic crisis brought new challenges for the corporate sector, which had to adapt to new requirements in order to avoid or at least minimize contagion. Ensuring worker protection should be the responsibility not only of citizens, but also of organizations. However, it is difficult to judge as it involves dealing with employee satisfaction with different variables with complex relationships between them. In order to be able to assess the satisfaction of the employees in a water laboratory, a data acquisition and evaluation model was developed and experienced in practice. The focus was on an Artificial Intelligence/Logic Programming/Entropy approach to data processing, system evolution and management (being the data collected through questionnaire’s answering), means that is brought into interrogation the immaterial part of this process, the emotions and people feelings. People is the most important asset in any organization. The proposed model offers a good accuracy of more than 90% and do not show overfitting. Future work will consider expanding the study to a larger sample in order to assess the influence of other variables such as age, gender or academic qualifications of employees on their satisfaction with the preventive measures resulting from the actual pandemic crisis. In addition, the relationships between the conscientious and the unconscious and their use for assessing and predicting the development and management of employee satisfaction.
Authors’ Information
Ana Fernandes is a PhD student in Biochemistry, Master in Environmental Chemistry, and Graduated in Chemistry at the University of Évora. She is Senior Technician in Health and Safety at Work and is Trainer, Consultant and Auditor of several entities, public and private, in the areas of Certification of Quality, Environment, Safety, Health and Safety at Work and Laboratory Accreditation. She is also a professor at several Higher Education institutions and Member of the Technical Commission 199-Health Information Systems of the Portuguese Institute for Quality. Her current interests include Quality Assessment, Health and Safety at Work, Organizational Efficiency and Public Health.
Rui Lima is since 2000 a professor and responsible for the Laboratories of the Escola Superior da Saúde at Vale do Ave, CESPU, Portugal. Degree in Food Engineering, with a Postgraduate Degree in Management of Organizations - Business Management Branch and Master in Entrepreneurship and Innovation in the Food Industry by the Polytechnic Institute of Viana do Castelo, Portugal. He is currently enrolled in the PhD Program in Intelligent and Adaptable Software Systems at the University of Vigo, Spain. The current areas of research and interest range from Social Entropy and its connection to Chaos Theory and Artificial Intelligence.
Margarida Figueiredo went to the University of Évora, where she studied Physics and Chemistry and obtained her degrees in 1988. She joined the University of Évora in 1990 and received her PhD in Chemistry in 2004. She is now Auxiliary Professor at the Department of Chemistry of University of Évora. She is a researcher at the Center for Research in Education and Psychology and her currents interests include the study of Methodologies for Chemistry Teaching, Quality Assessment in Laboratories.
Jorge Ribeiro is Adjunct Professor in the School of Technology and Management Polytechnic of the Institute of Viana do Castelo (IPVC) - Portugal, since 2006. He holds a PhD (Informatics Engineering) in 2011 at the Department of Electronic and Computation of the University of Santiago de Compostela, Spain. He is affiliated with the ADiT-Lab (Applied Digital Transformation Laboratory) of the Polytechnic of the Institute of Viana do Castelo. His main research interests are Artificial Intelligence, Software Engineering and Knowledge Discovery in Databases and he has been author and co-author of some papers in the field of Data Mining, Software Engineering, Knowledge Representation, Evolutionary Systems and Data Mining using Geographic Information Systems.
José Neves is Full Professor of Computer Science at Minho University, Portugal, and Emeritus Professor since 2019 at the same university. He also integrates the faculty of CESPU (Cooperative of Higher Education Polytechnic and University, CRL). He received his Ph.D. in Computer Science from Heriot Watt University, Scotland, in 1983. His current research interests relate to the areas of Logic Programming, Knowledge Representation and Reasoning, Evolutionary Intelligence and Machine Learning. Lately it has been focusing on the area of Computational Sustainability, namely on the relationship between the disciplines of Psychology, Economics, Computer Science, Mathematical Logic and Philosophy and their contributions to Decision Making in Business Environments.
Henrique Vicente went to the University of Lisbon, where he studied Chemistry and obtained his degrees in 1988. He joined the University of Évora in 1989 and received his PhD in Chemistry in 2005. He is now Auxiliary Professor at the Department of Chemistry at the University of Évora. He is a researcher at the REQUIMTE/LAQV (University of Évora) and at Algoritmi Research Center (University of Minho). His current interests include Water Quality Control, Lakes and Reservoirs Management, Data Mining, Knowledge Discovery from Databases, Knowledge Representation and Reasoning Systems, Evolutionary Intelligence, and Intelligent Information Systems.
Authors’ Contributions
Ana Fernandes participated in the elaboration of the questionnaire, their validation, and implementation, as well as, in the computational features of the work. In addition, she contributed to the discussion of the results and to the writing of the article.
Rui Lima participated in the elaboration of the questionnaire, their validation, and implementation, as well as, contributed to the discussion of the results and to the writing of the article.
Margarida Figueiredo participated in the elaboration of the questionnaire, their validation, and implementation, as well as, contributed to the discussion of the results and to the writing of the article.
Jorge Ribeiro participated in the computational features of the work, as well as, contributed to the discussion of the results and to the writing of the article.
José Neves participated in the computational features of the work, as well as, contributed to the discussion of the results and to the writing of the article.
Henrique Vicente participated in the computational features of the work, as well as, contributed to the discussion of the results and to the writing of the article.
Competing Interests
The authors declare that they have no competing interests.
Funding
This work has been supported by FCT - Fundação para a Ciência e Tecnologia within the R&D Units Project Scope: UIDB/00319/2020 and UIDB/50006/2020.